Container Timeline
Home > Select Project > Container > Container Timeline
Requirements
The WhaTap Kubernetes agent 1.7.6 or later is required. Timeline data is provided from the time point collected in version 1.7.6 or later.
The Container Timeline menu provides the feature to visually trace state changes of Container over time. You can visually see when the terminated Container was terminated, and which state Container was in at a specific time point. This allows you to analyze the past status, identify the causes of issues in the cluster, and monitor the operational stability.
Basic screen guide
After entering the Container Timeline menu, select Filter key and Filter value to view the data. You can see the Container list collected in the last 1 hour. You can visually see the state changes of Container along the time axis.
If you hover your mouse over each time zone, the start and end times of it and container status (running, waiting, terminated) appear.
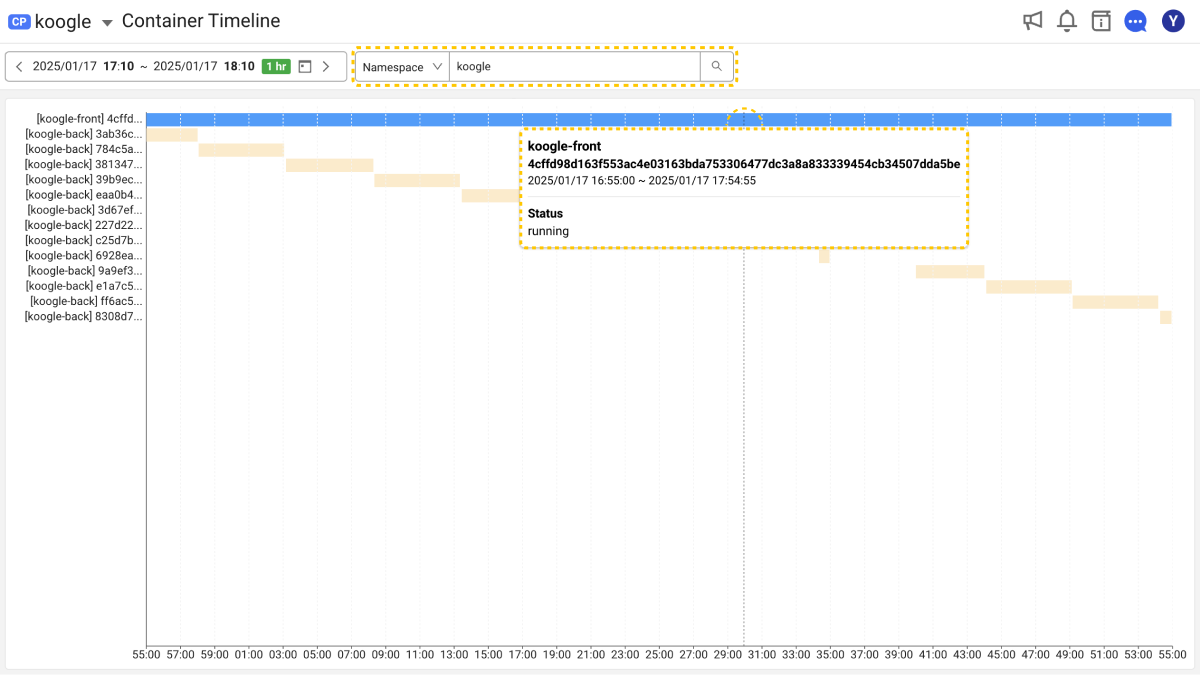
You can adjust the time range by dragging the zone on the timeline. Set a desired period to check the past data.
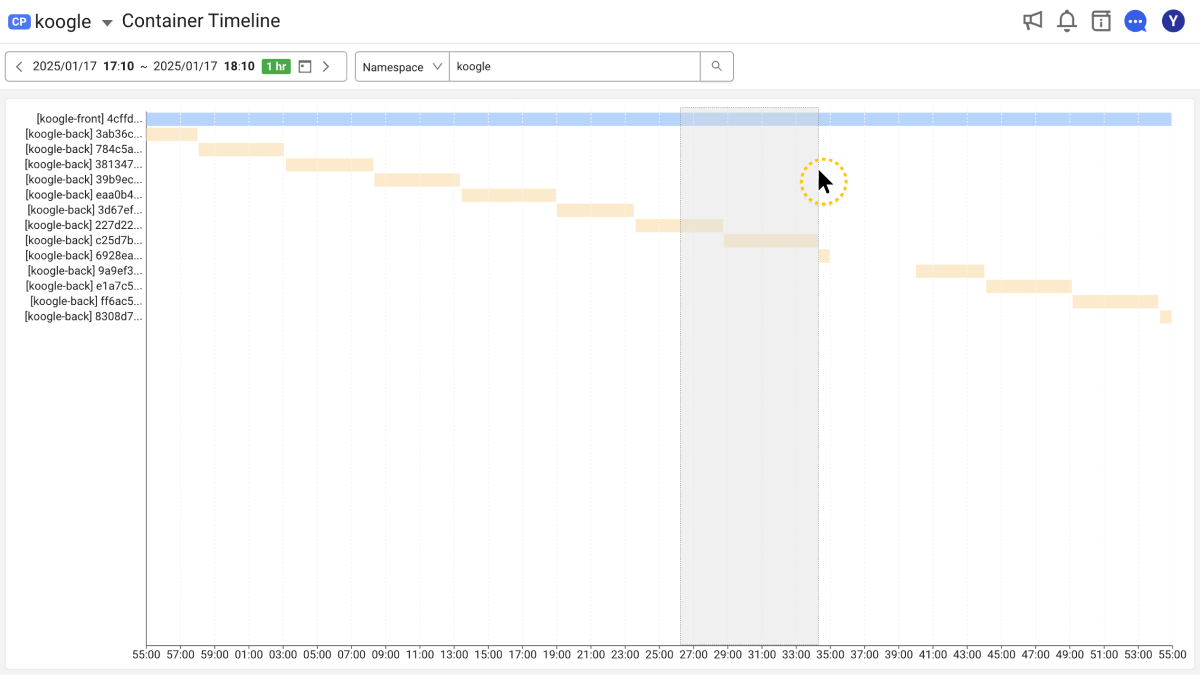
Additionally, when you select a specific period, you can check the Container status during the period in detail through Display Detail. For more information, see the Container timeline detail guidance.
For more information on how to use the time selector.
Container timeline details
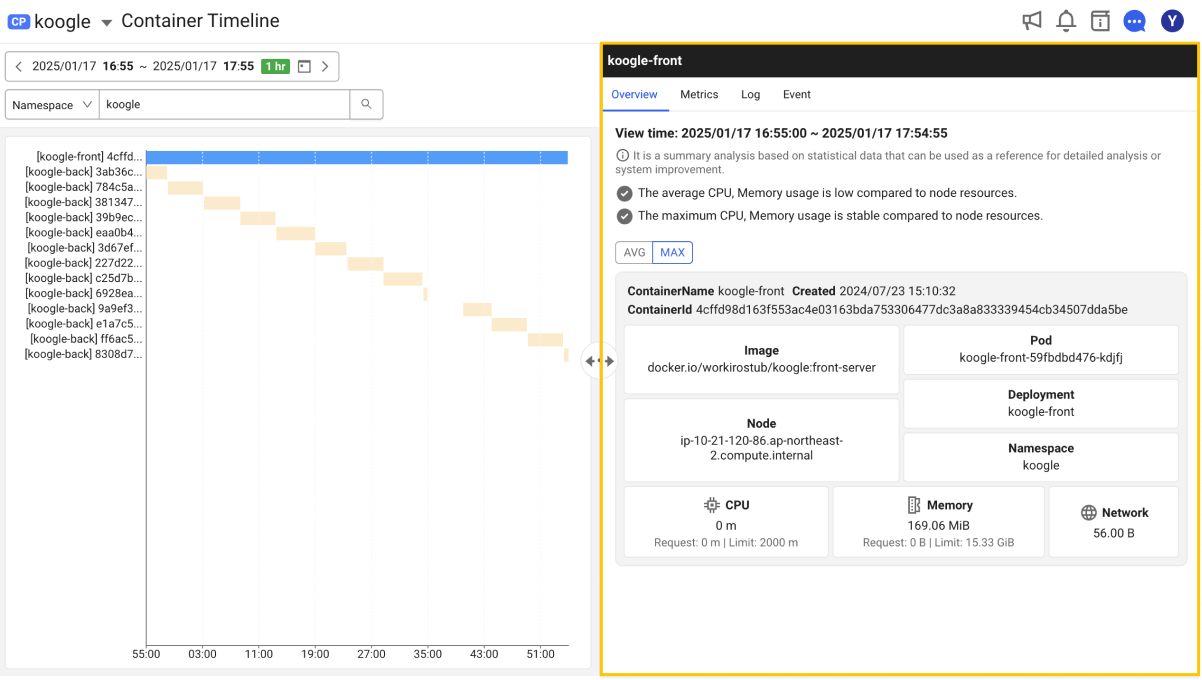
You can check the Container timeline details by selecting a specific segment or Container.
-
You can view detailed information of a Container at the time point through the Display Detail window on the right by selecting a zone to view.
-
You can select a Container name to view from the list on the left of the chart and view the entire status of the corresponding Container through the Display Detail window on the right.
Overview
The Overview tab provides a summary of the selected container and overall resource usage. You can comprehensively see the container information including the container image, the node on which the container is running, and the ownerReference of the Pod on which the container is running. You can see the resource usage and status of the container and monitor the performance and operational stability. You can also view the average usage and maximum usage for the selected period by clicking AVG and MAX.