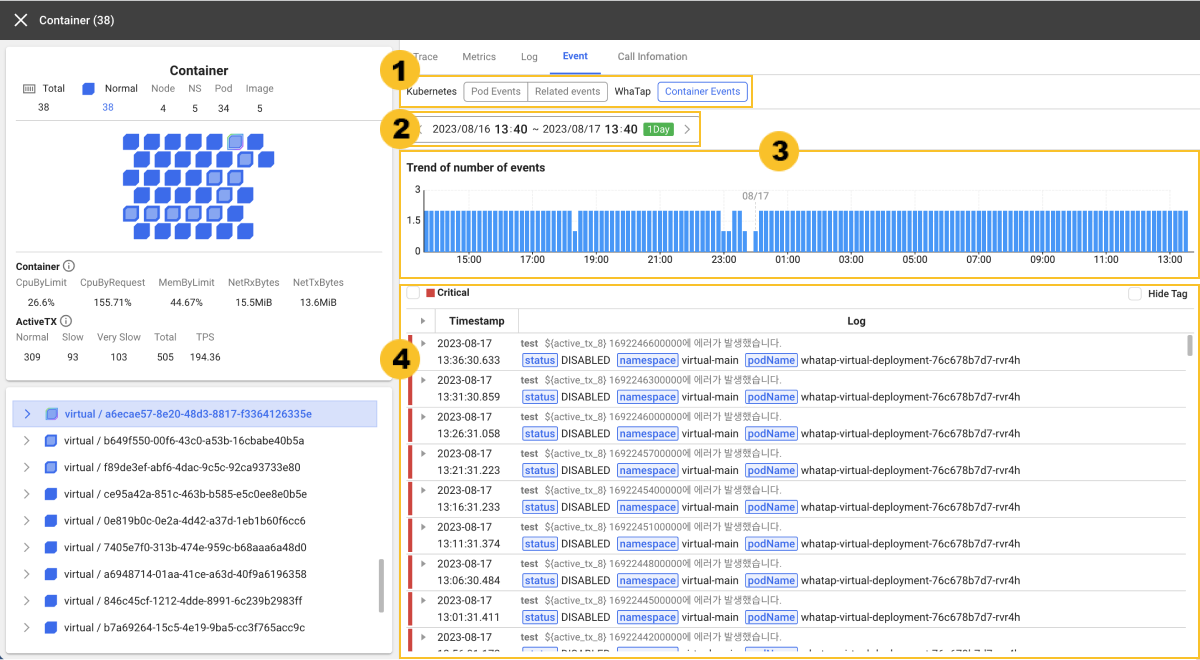
Event
Select Home > Select Project > Dashboard > Container Map > Target, and then in Detailed analysis, select the Event tab.
It provides records for all events that occur during the resource lifecycle. The events provided in WhaTap Kubernetes Monitoring are as follows.
-
Kubernetes Event (Kubernetes)
-
WhaTap event (WhaTap)
Basic screen guide

-
You can select a
Kubernetes event (Kubernetes) or WhaTap event (WhatTap) for query.
-
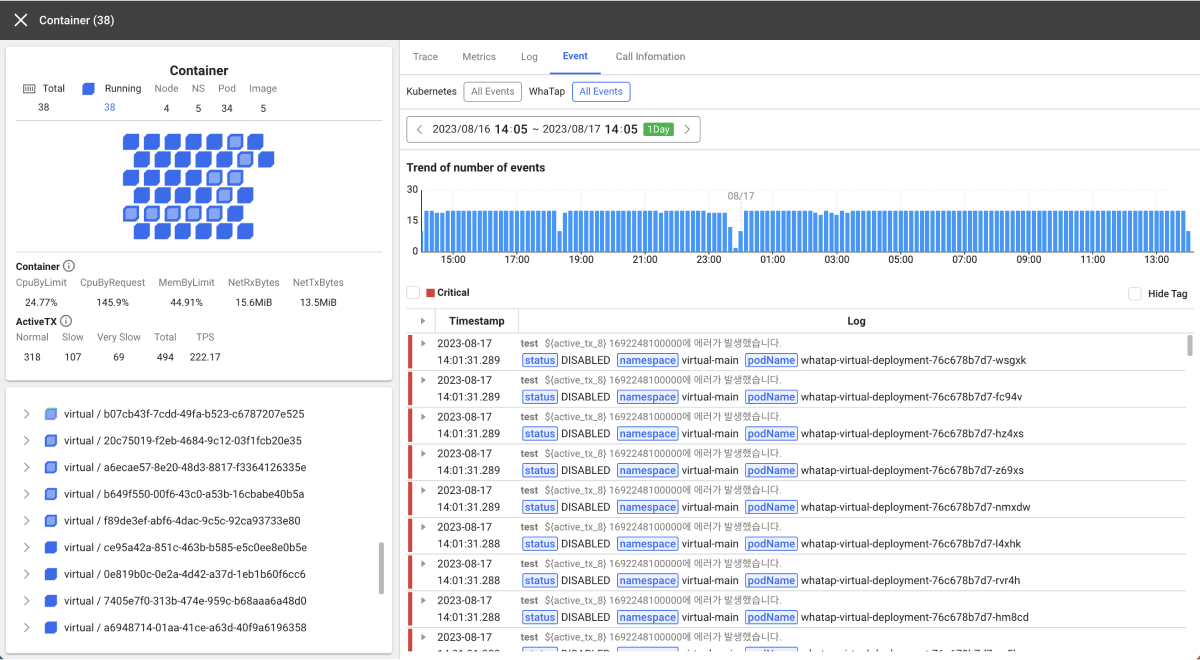
Selecting all or multiple blocks
You can search All Kubernetes events or All WhatTap events when all or multiple blocks are selected from Container Map and the card on the left.
-
Selecting clustering or individual block
When selecting Step 2 grouping or individual block at the top of Container Map, you can view the event. For more information about grouping (clustering), see the following.
NoteBefore entering the Display Detail screen, depending on the view or grouping selected at the top of Container Map, the events that can be viewed may differ.
-
-
Using the
time selector, you can set the time zone to view event records in. The default value is 1 day.
NoteFor more information on how to use the time selector, see the following.
-
The event number trend in the
selected time zone can be viewed with a bar chart.
-
In the
list format, you can see the event records.
-
If you select Hide Tag on the upper right of the event record list, you can see the timestamp and message excluding the tags while recording events.
-
Kubernetes events
-
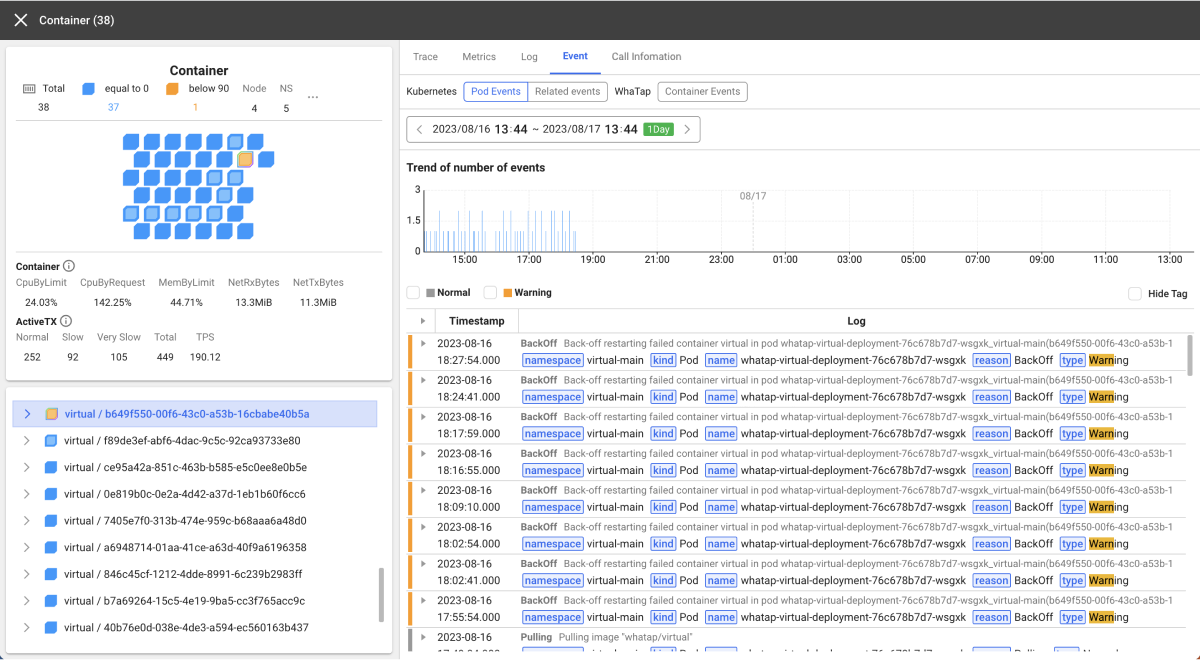
You can see the data by selecting a desired event type: Normal or Warning. These event types are identical to the event types provided by Kubernetes.
-
The bars on the left of each event indicate the event types. Gray means Normal, and orange means Warning.
-
-
WhaTap events
-
Select a desired event level to search among Critical, Info, and Warning.
-
The bars on the left of each event indicate the event levels. Gray indicates Info, orange Warning, and red Critical.
-
-
Kubernetes event
Kubernetes events are provided by Kubernetes itself. In the Kubernetes environment, you can use the kubectl get events command to get the event data of the Kubernetes cluster.
$ kubectl get events -A
 NAMESPACE   LAST SEEN   TYPE      REASON                   OBJECT                            MESSAGE
 community   15m         Normal    ScalingReplicaSet        deployment/baekdusan              Scaled up replica set baekdusan-59554d4859 to 5
 community   12m         Normal    ScalingReplicaSet        deployment/suraksan               Scaled down replica set suraksan-66fc4bf889 to 3
 community   5m18s       Normal    ScalingReplicaSet        deployment/baekdusan              Scaled down replica set baekdusan-59554d4859 to 3
 community   7m10s       Normal    Created                  pod/suraksan-66fc4bf889-h2cw8     Created container suraksan
 community   6m56s       Normal    Pulled                   pod/suraksan-66fc4bf889-h2cw8     Container image "123456789123.dkr.ecr.ap-northeast-2.amazonaws.com/suraksan:0.48" already present on machine
 community   7m9s        Normal    Started                  pod/suraksan-66fc4bf889-h2cw8     Started container suraksan
 community   2m7s        Warning   BackOff                  pod/suraksan-66fc4bf889-h2cw8     Back-off restarting failed container
 community   7m12s       Normal    Started                  pod/suraksan-66fc4bf889-t27rp     Started container suraksan
 community   6m54s       Normal    Pulled                   pod/suraksan-66fc4bf889-t27rp     Container image "123456789123.dkr.ecr.ap-northeast-2.amazonaws.com/suraksan:0.48" already present on machine
 community   7m12s       Normal    Created                  pod/suraksan-66fc4bf889-t27rp     Created container suraksan
 community   2m46s       Warning   BackOff                  pod/suraksan-66fc4bf889-t27rp     Back-off restarting failed container
 community   7m19s       Normal    ScalingReplicaSet        deployment/mountain               Scaled up replica set mountain-6795bfbc54 to 5
 community   27m         Normal    ScalingReplicaSet        deployment/mountain               Scaled down replica set mountain-6795bfbc54 to 4
 community   6m53s       Normal    Pulled                   pod/suraksan-66fc4bf889-mjbsj     Container image "123456789123.dkr.ecr.ap-northeast-2.amazonaws.com/suraksan:0.48" already present on machine
 community   7m10s       Normal    Created                  pod/suraksan-66fc4bf889-mjbsj     Created container suraksan
 community   7m10s       Normal    Started                  pod/suraksan-66fc4bf889-mjbsj     Started container suraksan
 community   2m10s       Warning   BackOff                  pod/suraksan-66fc4bf889-mjbsj     Back-off restarting failed container
 community   5m18s       Warning   FailedToUpdateEndpoint   endpoints/baekdusan-svc           Failed to update endpoint community/baekdusan-svc: Operation cannot be fulfilled on endpoints "baekdusan-svc": the object has been modified; please apply your changes to the latest version and try again
However, the event data is not stored continuously. The events that occurred after a specified time are no longer available.
WhaTap Kubernetes collects and stores all Kubernetes events that occurred in the user cluster environment. Event data such as pod, ReplicaSet, deployment, and namespace is provided according to the target to check.

The bars on the left of each event indicate the event types. Gray means Normal, and orange means Warning. The Kubernetes events provided by user selection are as follows.
| Selected target | Provided event | Provision-related event |
|---|---|---|
| All | All project events | |
| Namespace | All events under the namespace | |
| Node | Node events or all pod (container) events in the node | |
| Deployment | ① kind is Deployment② name is identical to the user deployment name | name starts with the user deployment name. |
| ReplicaSet | ① kind is ReplicaSet.② name is identical to the user's ReplicaSet name | name starts with the user ReplicaSet name. |
| Pod (container) | ① kind is Pod② name is identical to the user pod name | The pod starts with the name of the deployment to which the pod belongs or with the ReplicaSet name. |
Kubenetes events stored in WhaTap consists of message, namespace, kind, name, reason and type.
WhaTap event
WhaTap events occur depending on the event conditions registered by the event configuration. Under the Event tab on the detailed view screen of Container Map, you can see the list of events based on the WhaTap alert settings.

The bars on the left of each event indicate the event levels. Gray means Info, orange Warning, and red Critical. Available WhaTap events according to the selected target are as follows.
| Selected target | Provided event |
|---|---|
| All | All project events |
| Namespace | All events under the namespace |
| Node | onodeName is identical to the user node name |
| Deployment | deployment is identical to the Deployment name |
| ReplicaSet | replicaSetName is identical to the user ReplicaSet name |
| Pod | podName is identical to the user pod name |
| Container | containerId is identical to the user Container ID |
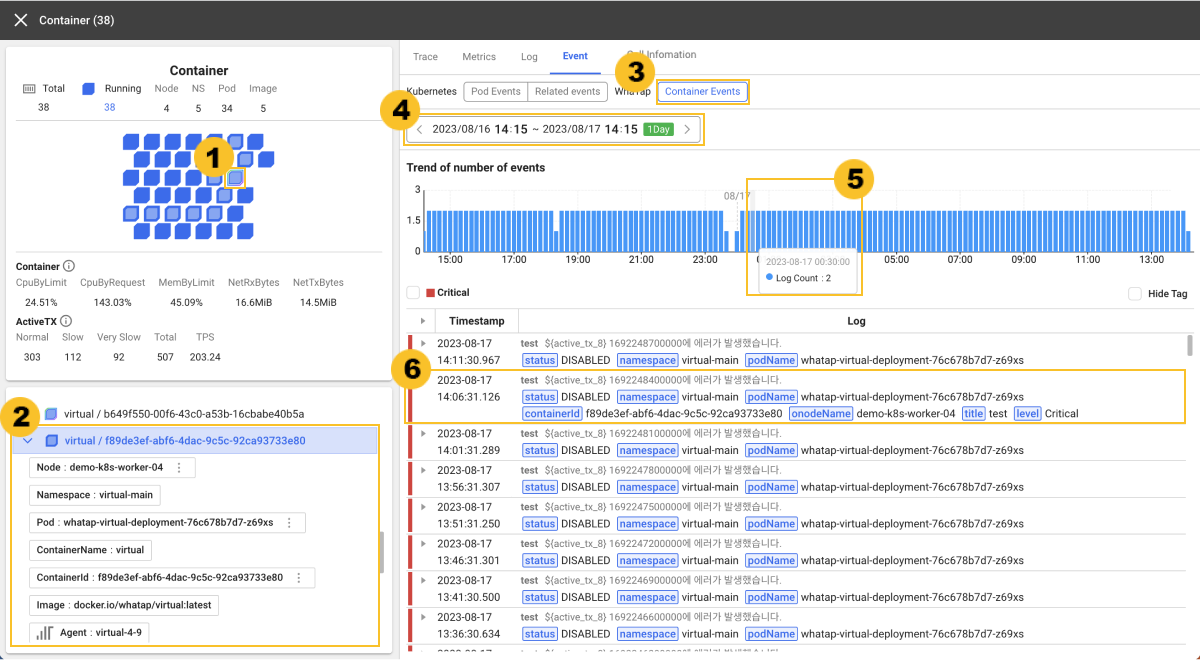
WhaTap events consist of the items such as message, status, title, and level. The following example screen displays the WhatTap Container Event records.

-
From the summary information card on the left of
Display Detail, select a target to view.
-
From the
summary information list, check the information of the selected one.
-
In the
Event tab, select a WhaTap event.
Before entering the Display Detail screen, you can view container events by setting the option at the top of Container map to Container view.
-
Through the
time selector, select a time to view. The default value is 1 day.
-
Through the
bar chart, see the Trend of number of events in the specified time zone.
If you look at the trend for event counts for the specified time ranges, you can see that two events have been counted.
-
From the
event history, check the information of event records. You can see the levels for each event through the bars on the left of the list. To check all event messages and tags, select the
icon.
In the event record list, you can view for two Warning level events:
CPU utilization of 85% or more by the container limitandGC count or more.