Service List
Home > Select Project > Cluster > Service List
The WhaTap Kubernetes agent 1.7.8 or later is required.
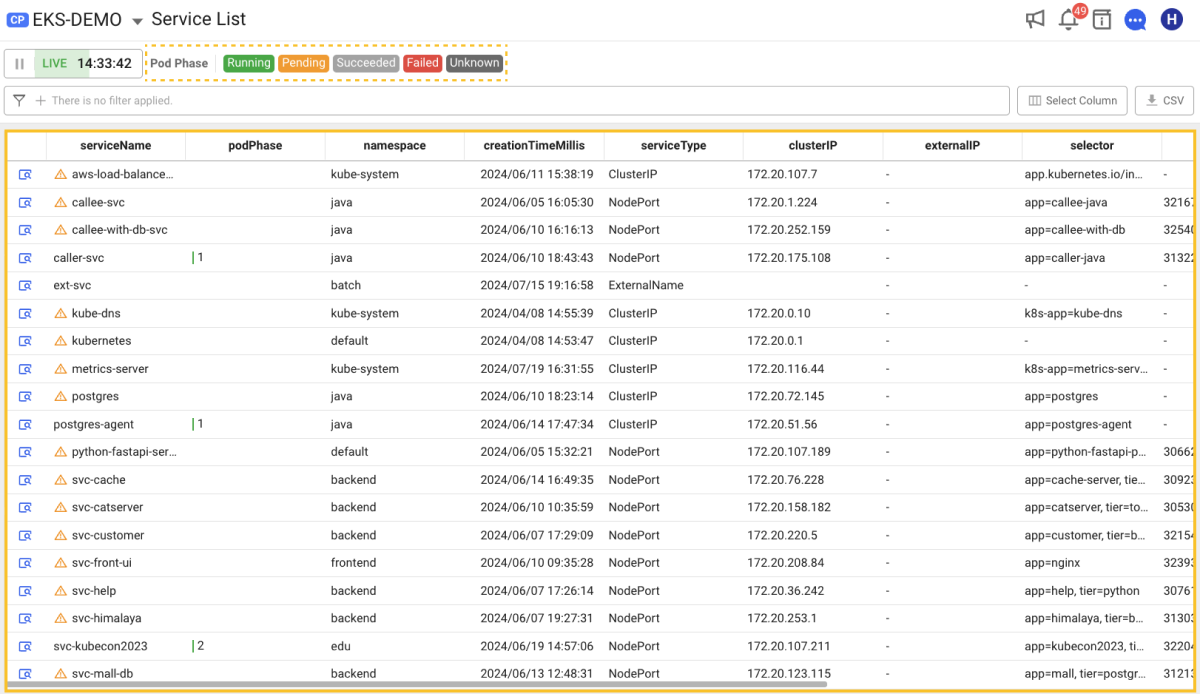
It views Service List. Through Service List of WhaTap Kubernetes Monitoring, you can easily check the network configuration within the cluster and efficiently monitor the configuration and status of each service.
In Kubernetes, a service is an object for accessing Pods inside and outside the cluster. In Service List, you can check the detailed configuration of each service at a glance, and monitor the status of connected Pods in real time. This allows you to quickly identify and resolve abnormal connectivity issues between services and Pods.
Basic screen guide
You can check the Service List information existing in the cluster as follows. The list is displayed based on the service information collected over the last minute based on the query time. You can identify and manage resources by various criteria such as namespace and label selector, and clearly check various properties of the service.

Pod Phase
The podPhase column displays the numbers of Pods connected to the service for each state. The status of a Pod is distinguished in colors. See the Pod Phase guidance above regarding the Pod status.
The Filter and Select Column instructions in the list menu are the same.
Filtering
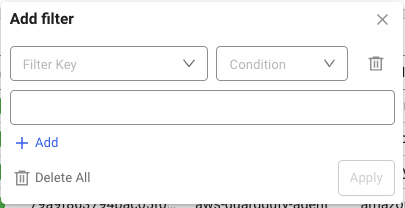
By using the Filtter option, you can select a desired for view. Through the and condition, multiple filters can be applied.
-
If you select
Add icon in the
Filter field, the Add filter window appears as follows:

-
Select Filter Key and Condition.
-
Select a value that meets the conditions.
-
-
Configure a filter and then select Apply to apply the filter.
-
To add multiple filters, select
Add icon in the Filter field or Add filter window.
Select Column
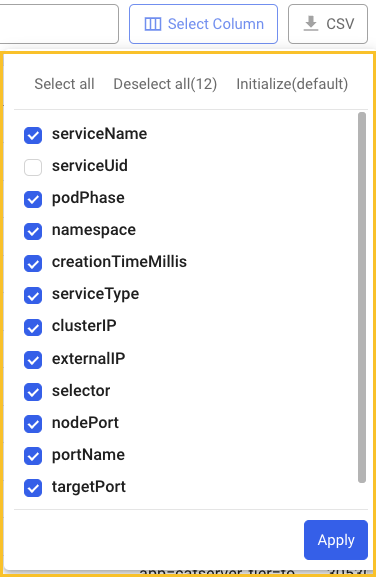
When using the Select column option, you can select the desired data to view the list.

-
The selected column list is kept even if you re-enter the menu.
-
If you select Reset, the predefined default key metric columns are selected. In this case, the column selection history is deleted.
-
After selecting a column, you can click Apply at the lower right to apply the selected values.
Display Detail
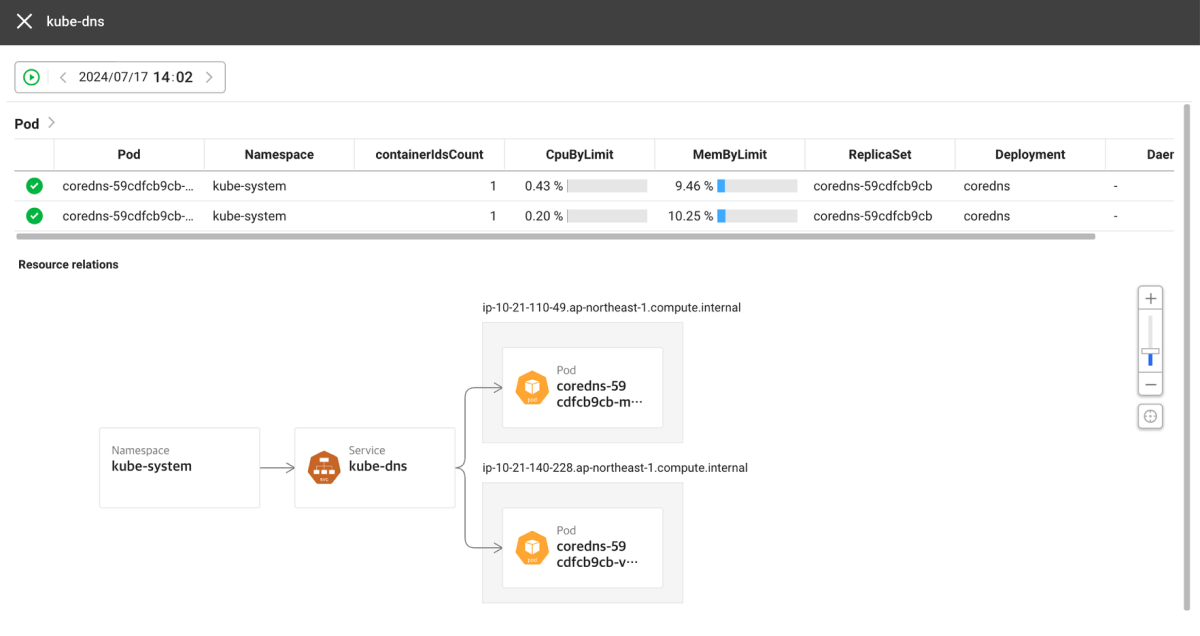
When you select the Display Detail icon of the service to search in the list, you can see the list of Pods connected to the service.
