Container List
Home > Select Project > Container > Container List
If the data for specific columns does not appear, your Kubernetes node agent may be outdated. In this case, update the Kubernetes agent so that enough data can be collected.
Through the Container List menu, you can see the container details of the current project in the list format.
-
Real-time data is updated every 10 seconds.
-
It provides the functions for container status summary, comparisons, filters, and CSV file download.
CSV file name, kubernetes_contianer_list_
{pcode}{timestamp}.csv_
Basic screen guide
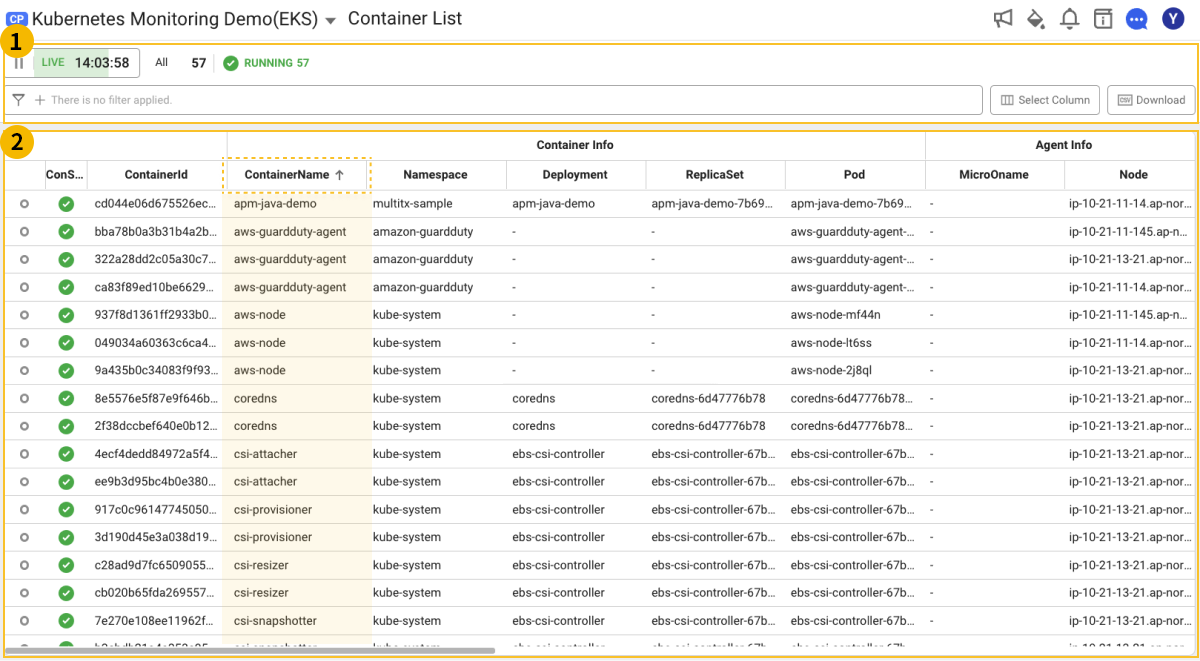
By selecting desired options in the ![]() area, you can view the data in
area, you can view the data in ![]() .
.
-
On the upper left of the
 area, you can see the total container count and the container counts for each status.
 -
When selecting a desired column in the
 area, you can sort the containers based on the corresponding column.
 -
When selecting the
 Node Info icon under the Node column in the area, the Node list menu appears.
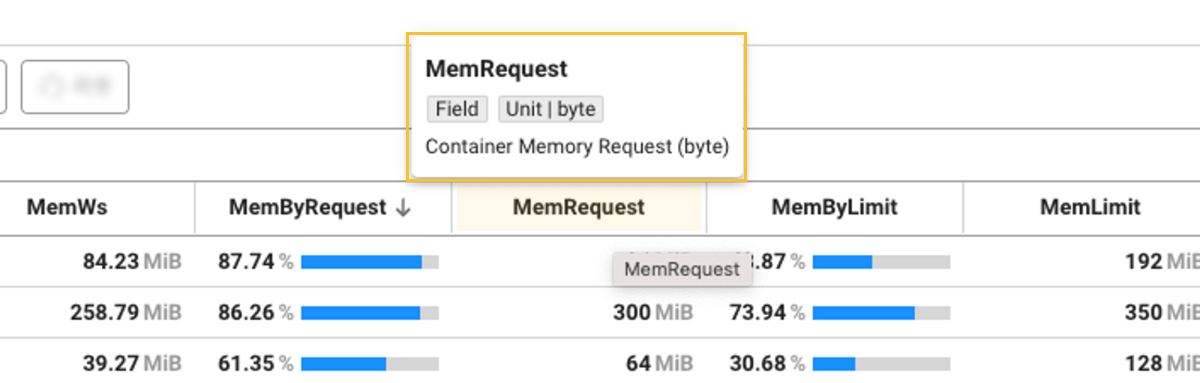
Metric information
-
If you place your mouse cursor over the desired column, the metrics provided by the column are shown as follows:
-
In the column list of the Select Column option, you can see the metrics for each column in the column list of the option screen. When you place the mouse cursor over a desired column, the
 INFO icon appears to the right of the column name. If the mouse cursor is placed over the INFO icon, you can see the metric as follows:
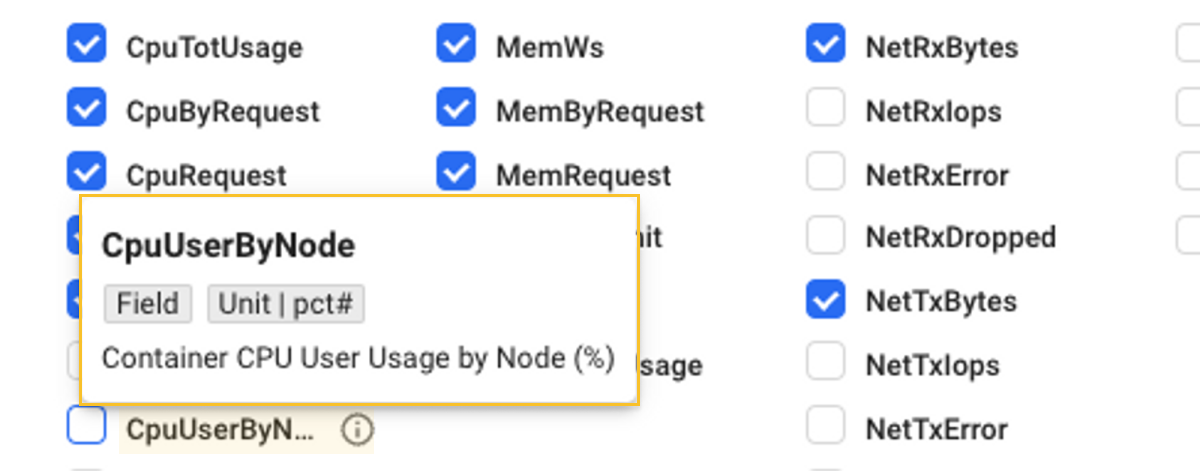
Filtering
By using the Filtter option, you can select a desired Container list for view. Through the and condition, multiple filters can be applied.
-
If you select
 Add icon in the
  Filter field, the Add filter window appears as follows:
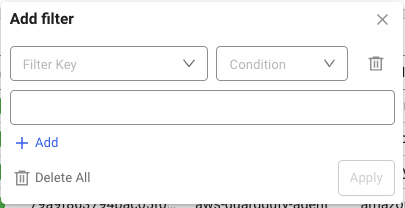
-
Select Filter Key and Condition.
-
Select a value that meets the conditions.
-
-
Configure a filter and then select Apply to apply the filter.
-
To add multiple filters, select
Add icon in the Filter field or Add filter window.
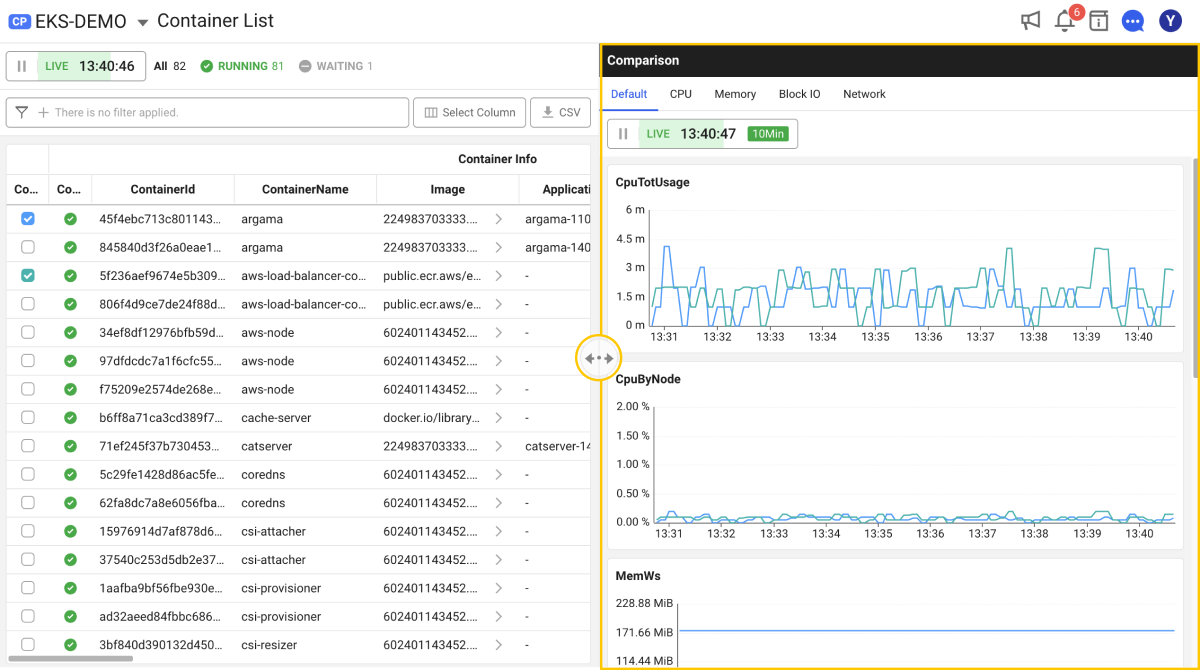
Comparing
The Compare option allows you to see a comparison chart of key metrics for multiple containers. When you select the Compare check boxes of the containers to view in the list, a window comparing details for the containers appears on the right as shown below.
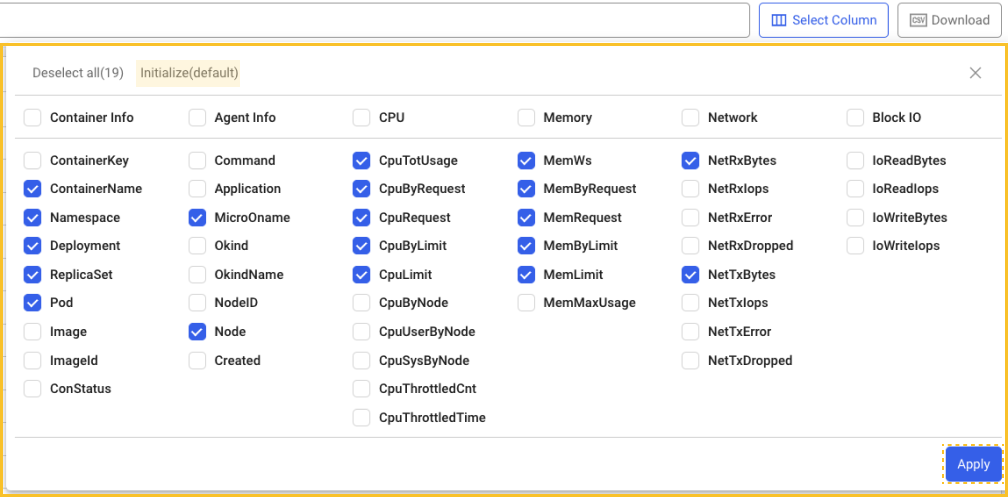
Select Column
When using the Select column option, you can select the desired Container data to view the list.
-
The selected column list is kept even if you re-enter the menu.
-
If you select Reset, the predefined default key metric columns are selected. In this case, the column selection history is deleted.
-
After selecting a column, you can click Apply at the lower right to apply the selected values.