PostgreSQL Monitoring
The DB performance management monitors the database performance in real time, diagnoses and analyzes problems, tunes problematic SQLs, and monitors whether problems have been resolved.
The WhaTap database monitoring service is designed to manage a series of operations in cycles. It is configured to help maintain consistent levels of availability and performance by monitoring, diagnosing, and analyzing the database behaviors. When a problem occurs in the database, this service sends an alarm to the staff to recognize the situation and helps you identify the root cause by analyzing the database situation more precisely through the collected data.
For more information about the supported features for each database platform, see the following.
PostgreSQL Monitoring features
-
Realtime DB Monitoring
It collects real-time DB performance metrics and the data of running clients (active sessions). You can check the operation status at a glance to immediately recognize the load occurrence status, and you can immediately recognize any problems through alarm settings.
-
Specific point analysis
By using the metrics' short-term trends, long-term trends, and metric comparison functions, you can analyze problems at the past. The database parameter change history is traced.
-
Efficient structure even on a large scale
Even when managing multiple DB servers, it provides an optimal analysis environment through unified performance data collection and efficient data storage structure.
-
Cloud DB monitoring available
Structure for query-based monitoring data collection does not depend on the DB server type. DBs in AWS, GCP, Azure, and OCI environments can also be monitored, and monitoring for cloud resource metrics and integrated items is also possible.
-
Integrated Monitoring
If you have installed all applications, servers, and database monitoring products, you can quickly analyze the causes of failures through linked views when detecting service problems.
-
WhaTap SaaS
You can select from various database products, and freely set the period of use by monthly subscription. (available also with an installation type)
New features in Database Monitoring V2
The PostgreSQL Monitoring V2 with enhanced charting and collecting features has been updated. Update your agent to get the latest features.
The minimum version of the agent to use the PostgreSQL monitoring V2 is 1.6.7. For more information about the agent update, see the following.
-
Provision of DB metrics data
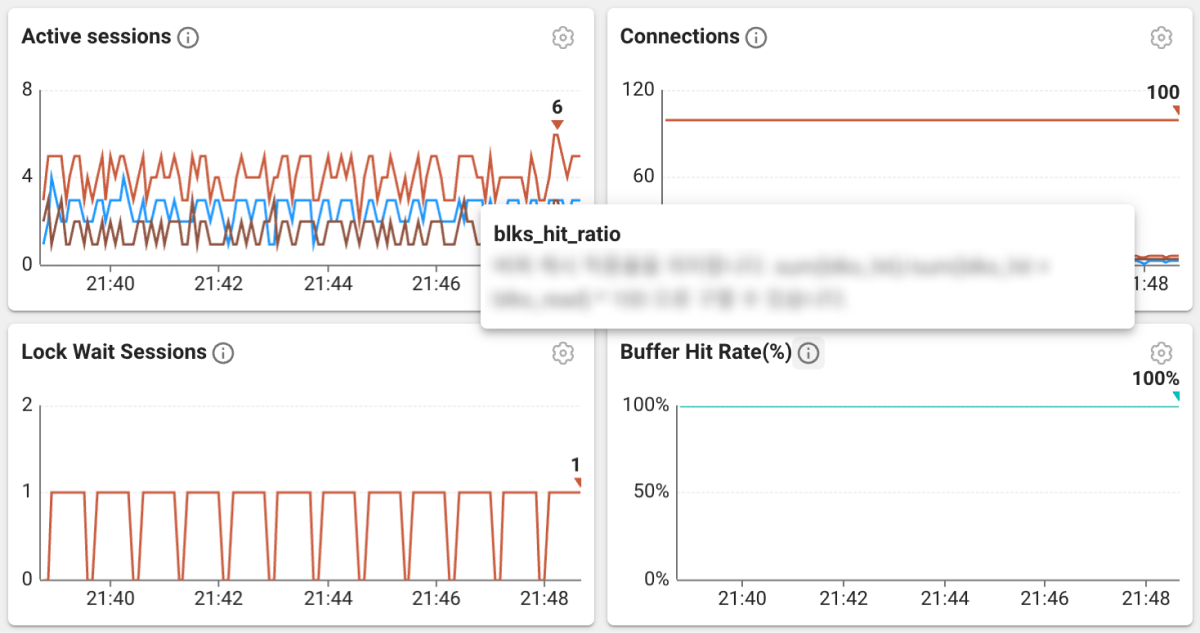
Helps and tuning tips for metrics are added, and convenience is provided by categorizing and recommending the metrics so that users can easily understand numerous metrics. (multilingual support planned)
-
Dashboard improvements
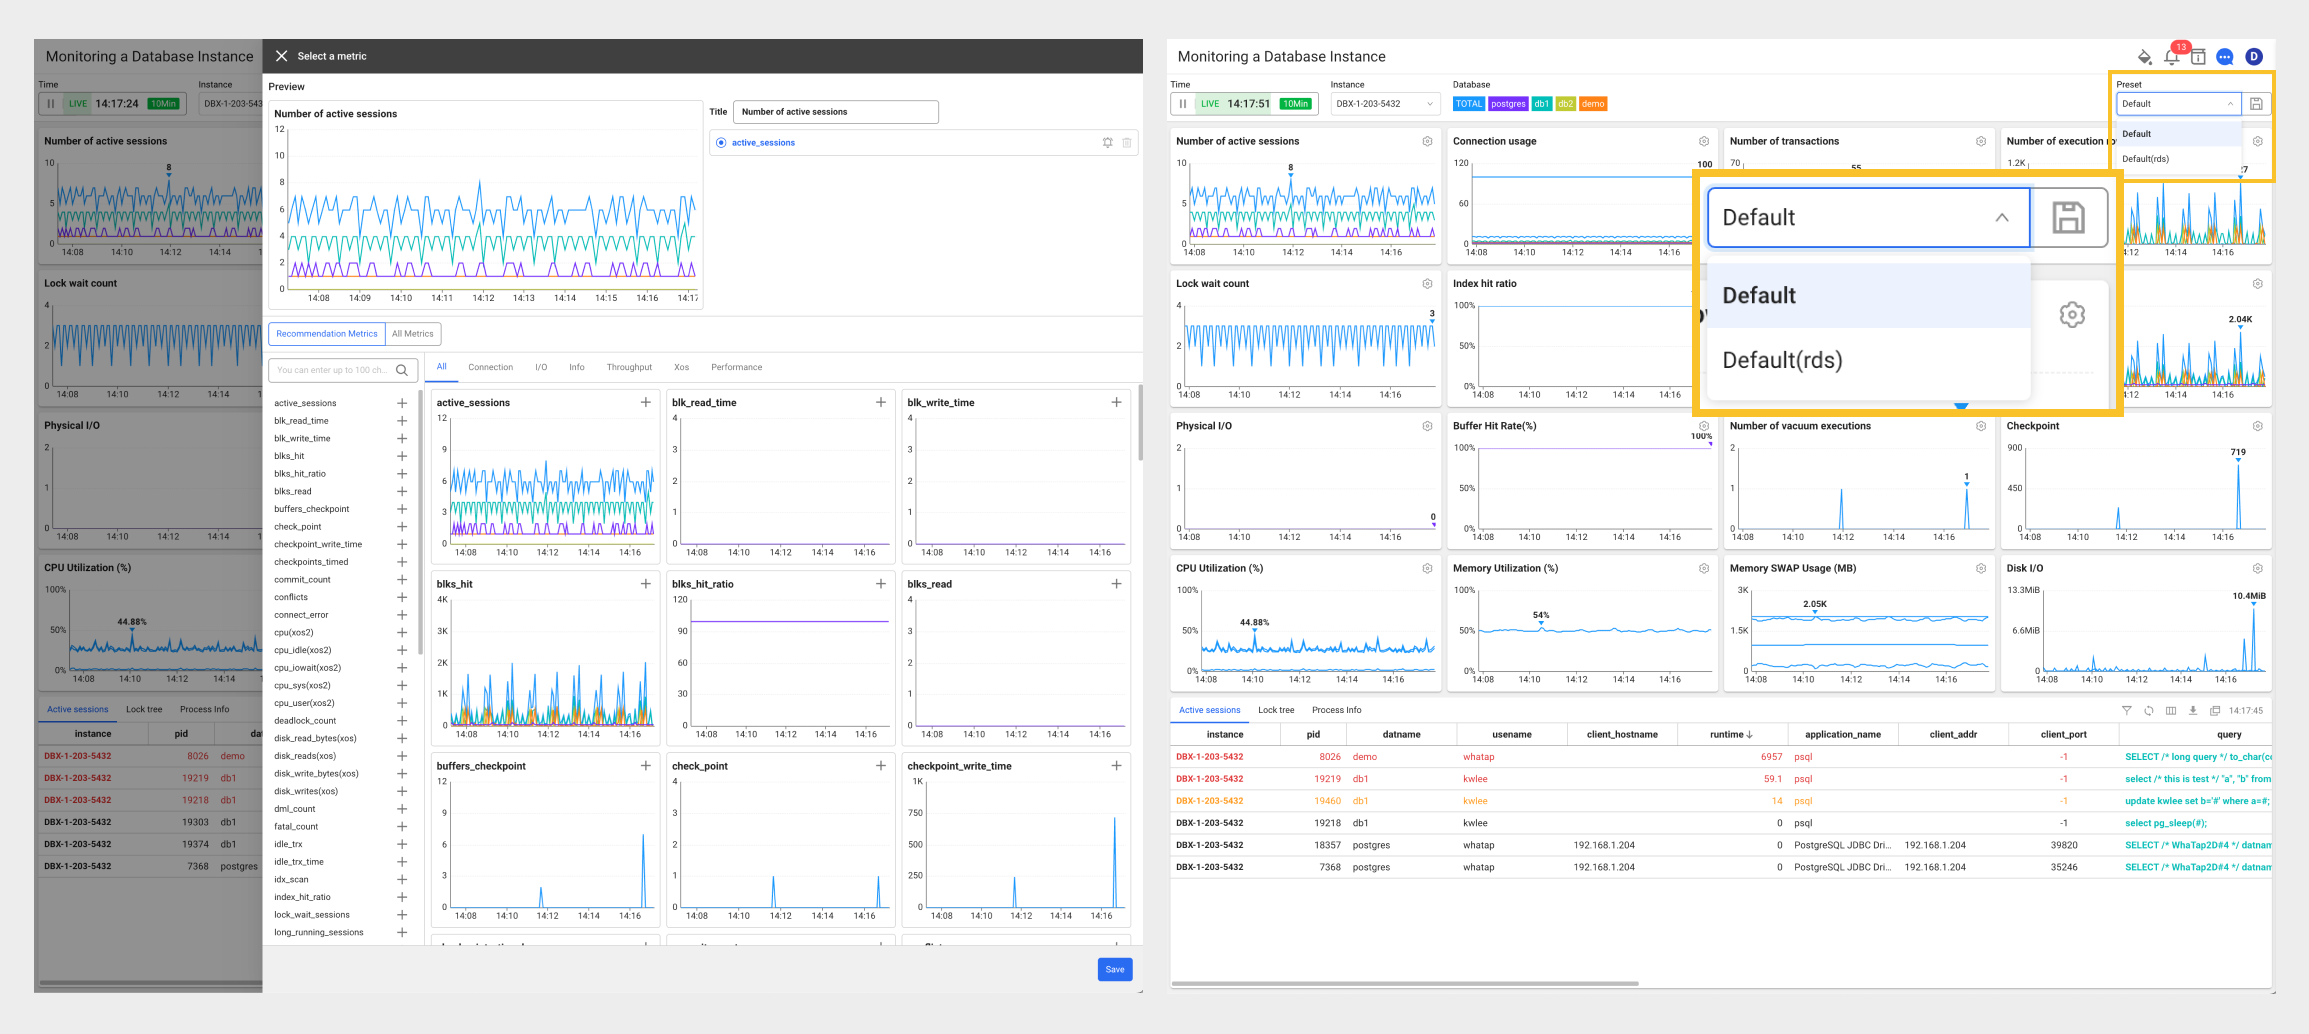
For dashboards, the function to add multiple metrics is provided to one chart. In addition, by adding presets, users can quickly check the desired metrics.
-
UI improvements
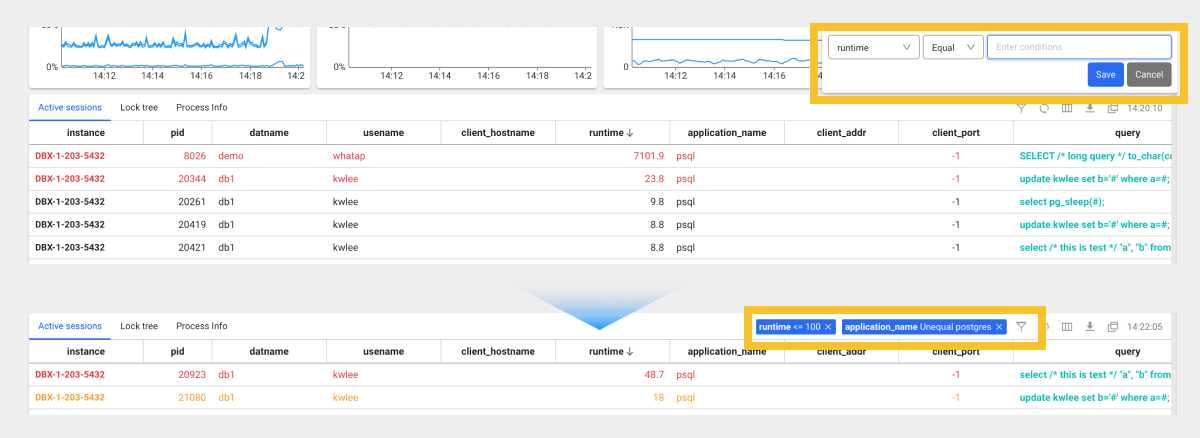
Improvements in the instance monitoring filter
Session Kill UI improvements
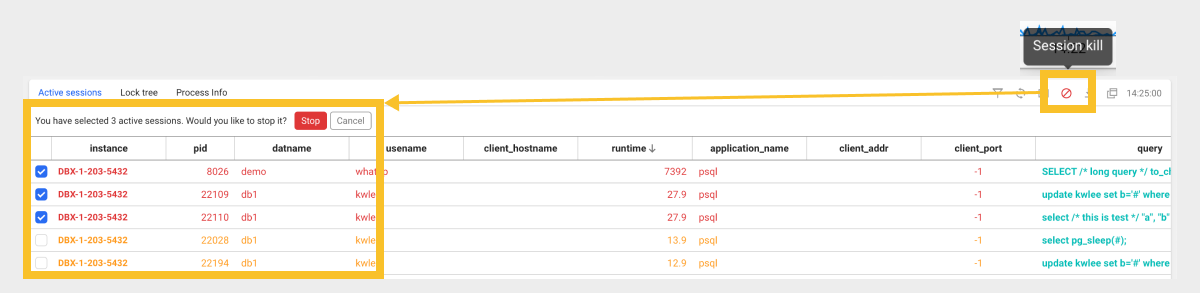
The instance monitoring filter has been improved, and the user interfaces for Session Kill have been improved.
-
Addition of Flex Board templates and widgets
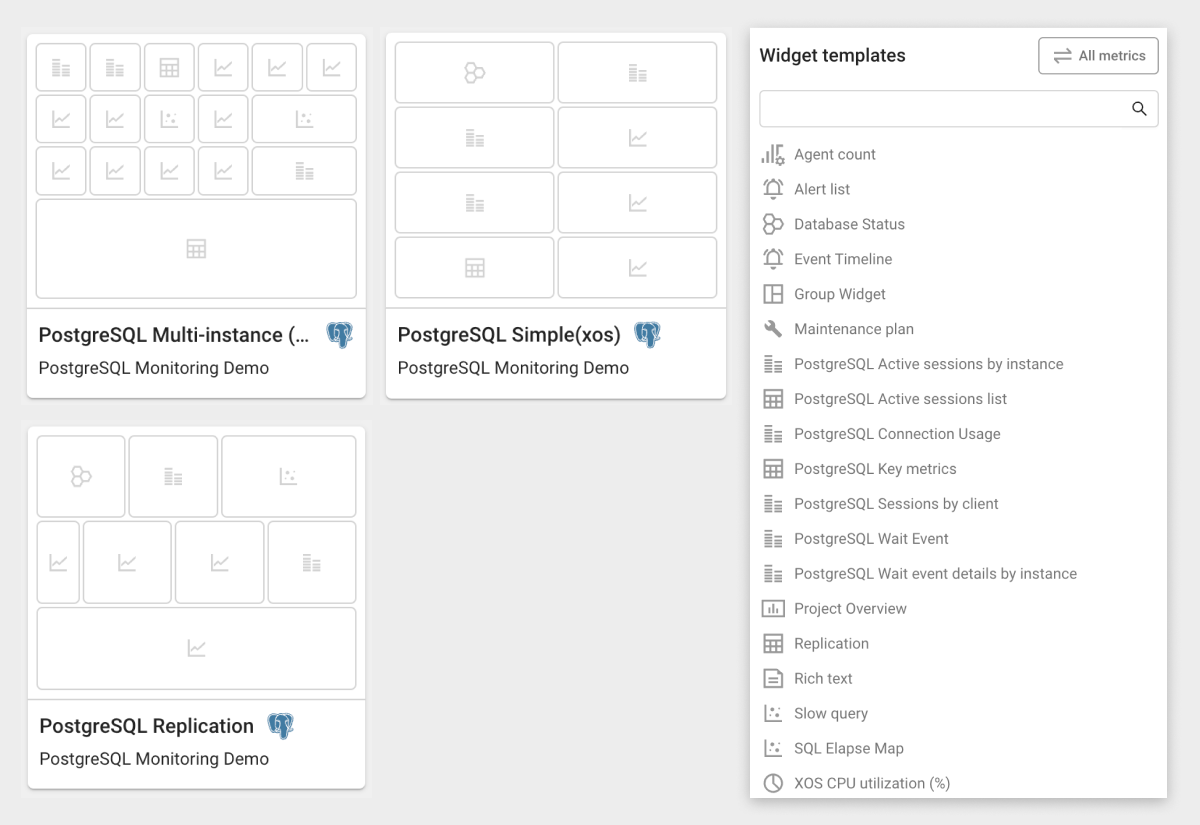
By converting many DB indicators into metrics, various templates and widgets have been provided.
-
Log
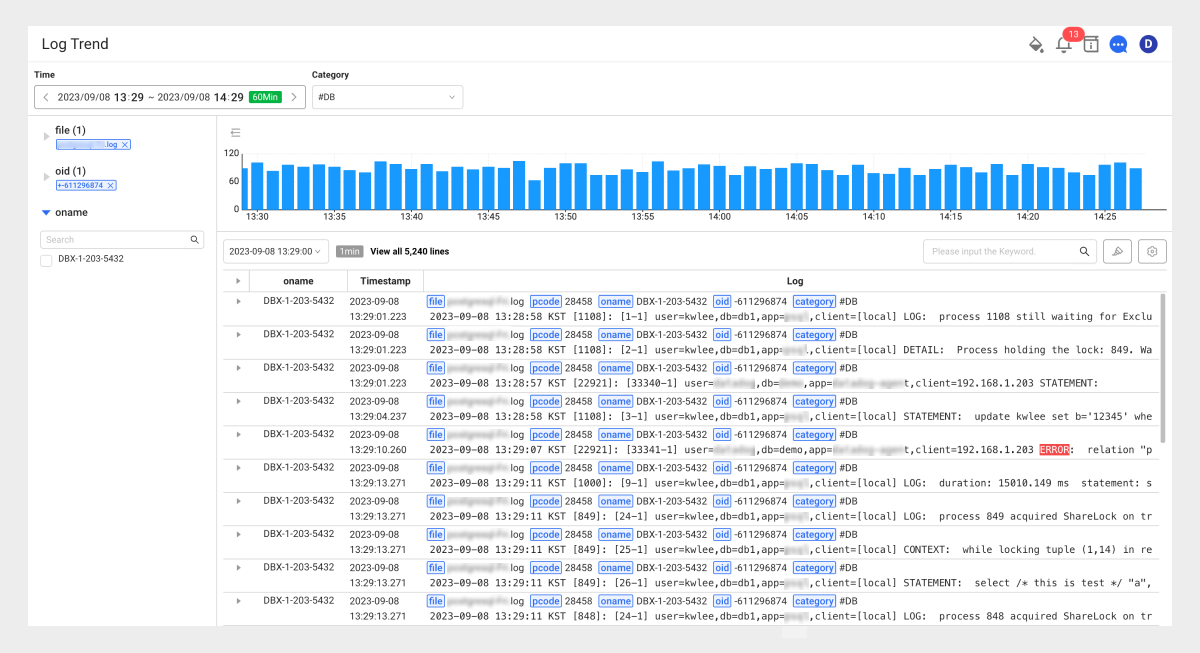
Through Live Tail, Log Trend, Log Search, and Log Alert, you can search DB logs and can see their trend as well as the log-related alerts.