Log
Home > Select Project > Log
You can check various logs related to Kubernetes. The monitoring categories provided by WhaTap Kubernetes are as follows:
| Category | Description |
|---|---|
#K8sEvent |
|
#WhatapEvent |
|
containerStdout |
|
AppLog |
|
Depending on the settings, duplicate log contents may be stored. Be sure to check for duplicates.
Setting the containerStdOut log filter
Home > Select Project > Management > Agent CONF.
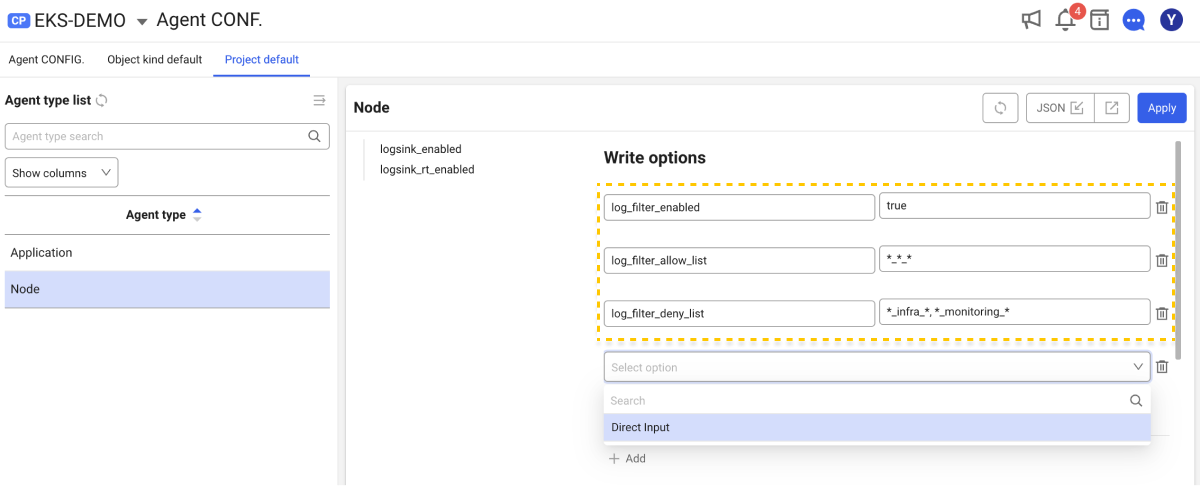
The following guides you to filtering options to select information needed in the Kubernetes logs. You can set which logs to allow or exclude through filtering. In Agent CONF., select Direct Input in the Write options manner.
Log naming conventions
The Kubernetes containerStdOut logs are generated under the /var/log/containers/ path on the node. They keep the following naming conventions.
<podName>_<namespace>_<containerName>-<containerId>.log
Log filtering options
-
log_filter_enabled bool
Default
falseIt sets whether to use log filters.
-
log_filter_allow_list list
It sets the list of logs to allow. It indicates the items to be included for filtering.
-
log_filter_deny_list list
It sets the list of logs to exclude. It indicates the items to be excluded for filtering.
Log filtering operation
Log filters work only when the log_filter_enabled option is active. You can selectively collect logs via log_filter_allow_list and log_filter_deny_list when the value of the option is set to true.
Log filters work on a blacklist basis. For example, if you enable log_filter_enabled and do not set the items to be added to the log_filter_allow_list option, the log collection for all containers is blocked by default.
Additionally, in the log filters, deny rules take precedence over allow rules. If the same items are set in both allow and deny rules, the deny rule takes precedence and logs are not collected.
Log filter example
Collecting logs for a single namespace
- Allow log_filter_allow_list
*_infra_*
All containers that exist in the infra namespace are targeted for collection.
Collecting multiple namespace logs
- Allow log_filter_allow_list
*_infra_*, *_monitoring_*
All containers that exist in the infra and monitoring namespaces are specified as collection targets.
Pods containing specific terms are excluded.
-
Allow log_filter_allow_list
*_*_* -
Deny log_filter_deny_list
*prod*_*_*
All containers are targeted for collection, but the logs that contain prod in podName are excluded.
Pods containing specific terms are collected.
- Allow log_filter_allow_list
*prod*_*_*
Only the logs that contain prod in podName are collected.
Multi-namespace logs are collected and Pods containing specific terms are excluded.
-
Allow log_filter_allow_list
*_infra_*, *_monitoring_* -
Deny log_filter_deny_list
*prod*_*_*
The logs for the infra and monitoring namespaces are collected, and the logs that contain prod in podName are excluded.
The container logs that start with a specific term in the container name are excluded.
- Allow log_filter_allow_list
*_*_db-*
The container logs whose containerName starts with db in all namespaces are excluded.
Live Tail
Home > Select Project > Log > Live Tail
You can check the content in the WhaTap Kubernetes monitoring category in real time. For more information about Live Tail, see the following.
Log Trend
Home > Select Project > Log > Log Trend
You can see the stored log trend by setting a time range. For more information about Log Trend, see the following.
Log Search
Home > Select Project > Log > Log Search
You can search the stored logs by setting a time range. For example, you can see the standard out logs of a specific container or all containers in the deployment at once. You can also highlight a specific keyword for display.
For more information about Log Trend, see the following.
Setting the log
Home > Select Project > Log > Setting
You can configure various log-related settings including log activation. For more information about the log settings, see the following.