Pod List
Home > Select Project > Workload > Pod List
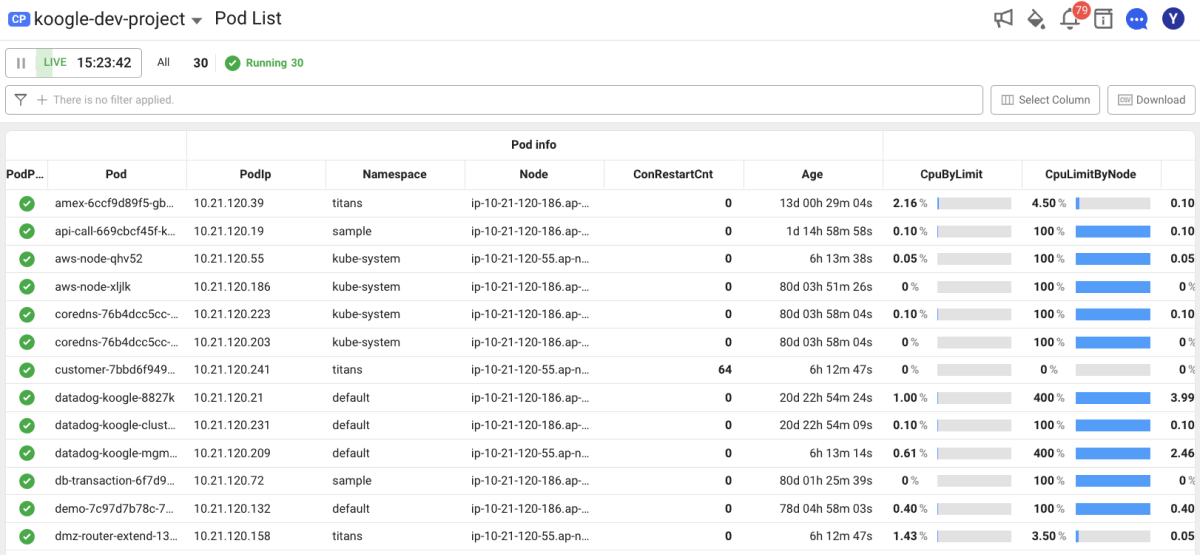
It displays the Pod list. If you select a desired column, you can search the Pod list sorted by that column.
-
Real-time data is updated every 10 seconds.
-
You can check the total number of Pods and the Pod counts by status on the upper left of the sreen.
-
It provides the services for searching, column sorting, and detailed view, and CSV file downloading.
CSV file name, kubernetes_pod_list_
{pcode}_{timestamp}.csv
In the list-type menus such as Node list, Container list, Pod list, and Container application list, the guides to Metric information, Filter, and Column selection are the same.
Metric information
-
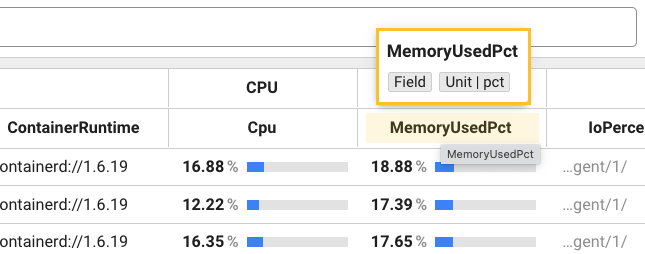
If you place your mouse cursor over the desired column, the metrics provided by the column are shown as follows:
-
In the column list of the Select Column option, you can see the metrics for each column in the column list of the option screen. When you place the mouse cursor over a desired column, the
 INFO icon appears to the right of the column name. If the mouse cursor is placed over the INFO icon, you can see the metric as follows:
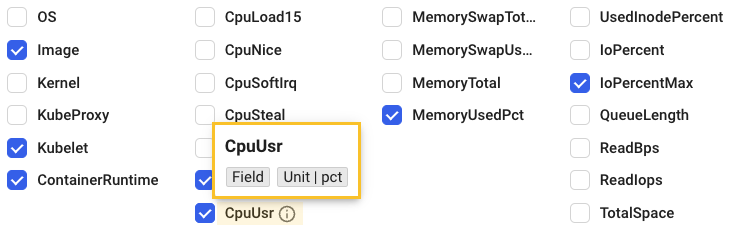
Filter
By using the Filtter option, you can select a desired Pod list for view. Through the and condition, multiple filters can be applied.
-
If you select
 Add icon in the
  Filter field, the Add filter window appears as follows:
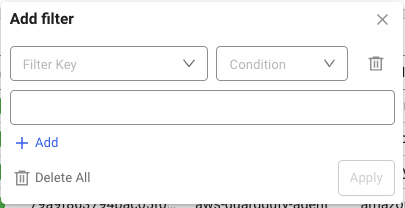
-
Select Filter Key and Condition.
-
Select a value that meets the conditions.
-
-
Configure a filter and then select Apply to apply the filter.
-
To add multiple filters, select
Add icon in the Filter field or Add filter window.
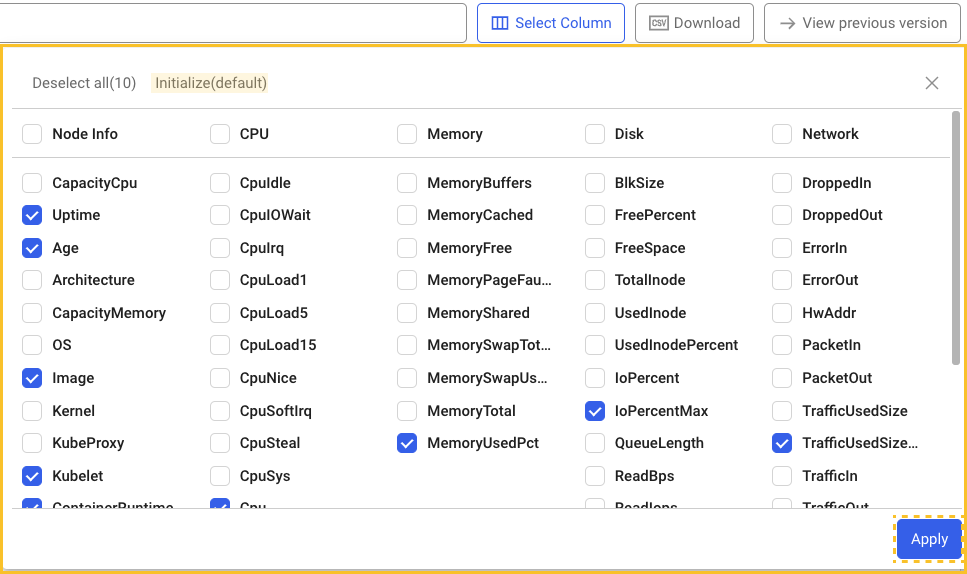
Select Column
When using the Select column option, you can select the desired Pod data to view the list.
-
The selected column list is kept even if you re-enter the menu.
-
If you select Reset, the predefined default key metric columns are selected. In this case, the column selection history is deleted.
-
After selecting a column, you can click Apply at the lower right to apply the selected values.
Display Detail
If the ![]() Display Detail icon is selected in Pod, you can see the information details on the Pod.
Display Detail icon is selected in Pod, you can see the information details on the Pod.
The Trace, Metrics, Log, Event, and Pod summary analysis tabs of the detailed view window are the same as in Container map's Display Detail.
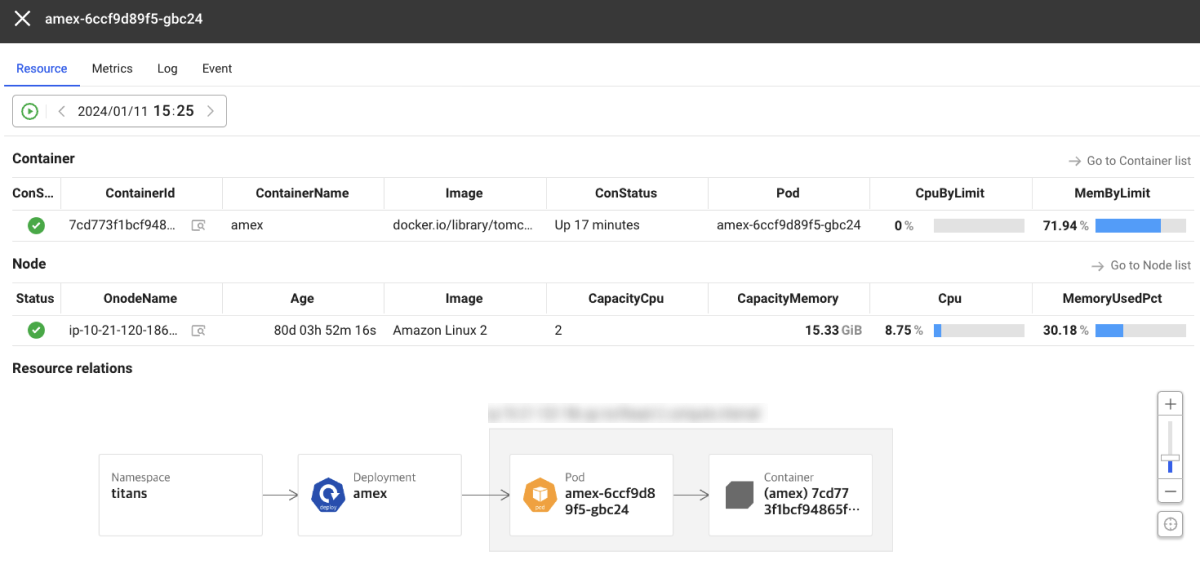
Resources
After selecting a target, you can see the resource list and relationship diagram for the selected resource in the Resource tab in the detailed view.
Summary
It provides a summary of the list of resources for the selected resource. If you select the detailed view icon next to the resource name, the corresponding resource list screen appears.
-
Container: Goes to Container list with only the container filtered.
-
Pod: Goes to Pod List with only the Pod filtered.
-
Node: Goes to Node details with the node name selected.
-
ReplicaSet: It provides a summary for active Pods and containers based on ReplicaSet.
Relational diagram of resources
You can visually see the relationships and status between resources. As in the list, you can check the detailed metric information by hovering your mouse over a Pod, container, or application. If you select a resource, the resource list page appears.
Pod summary analysis
-
Basic Info: You can check the Pod's cluster name, namespace, startup time, current state (Phase), and such.
-
Kubernetes Events: You can check if any problem happened by looking at event logs related to the recent Pods.
-
Executor: It identifies the controller (DaemonSet, Deployment, etc.) that created the Pod.
-
Node Info: It provides detailed specifications of the node on which the Pod is running, including the operating system, kernel version, CPU, and memory.
-
Resource Usage: It displays the CPU and memory usage for all containers in the Pod, and the utilization compared to the set resource limits.
Currently, the summary analysis is available only in Korean.