Report
Home > Select Project > Report
If you click ![]() in Report on the screen, you can see various analysis reports classified by daily, weekly, and monthly. Select a desired report format, and then set the date and time to view and filtering options. You can check the selected report by selecting
in Report on the screen, you can see various analysis reports classified by daily, weekly, and monthly. Select a desired report format, and then set the date and time to view and filtering options. You can check the selected report by selecting ![]() .
.
Report is a document that reports the service usage status and failure records for individual projects. The persons in charge of service monitoring share the status report with the people of related departments. The monitoring data analysis is important because it serves as a metric for determining the direction of improvement. However, it is cumbersome to aggregate and document data from multiple dashboards.
WhaTap's Report menu supports automated report creation. Through the Report menu, you can create weekly reports, share reports at the set times, and manage various templates.
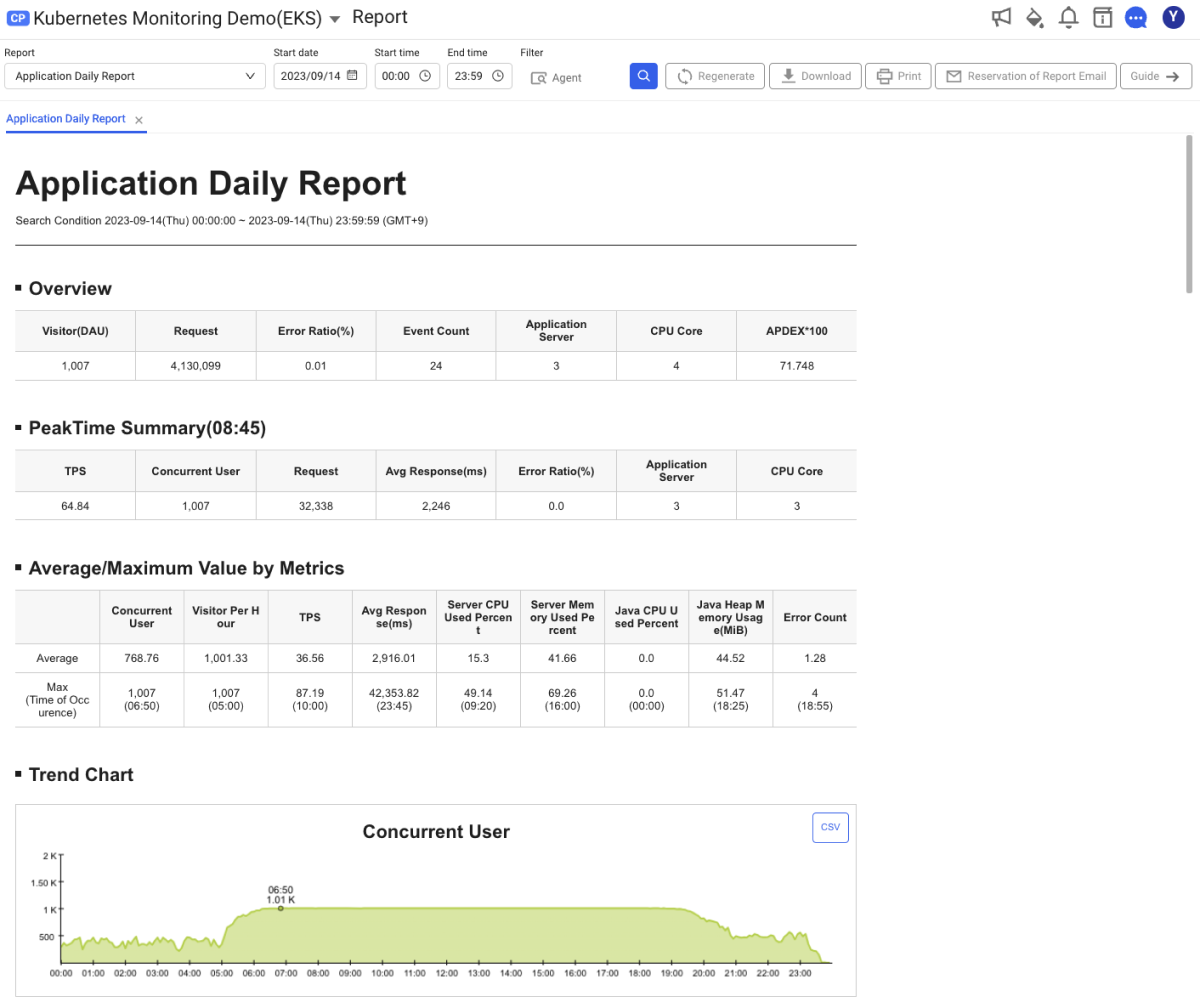
- Select Download to download the report. You can download it in HTML format.
- Select Print to print the report.
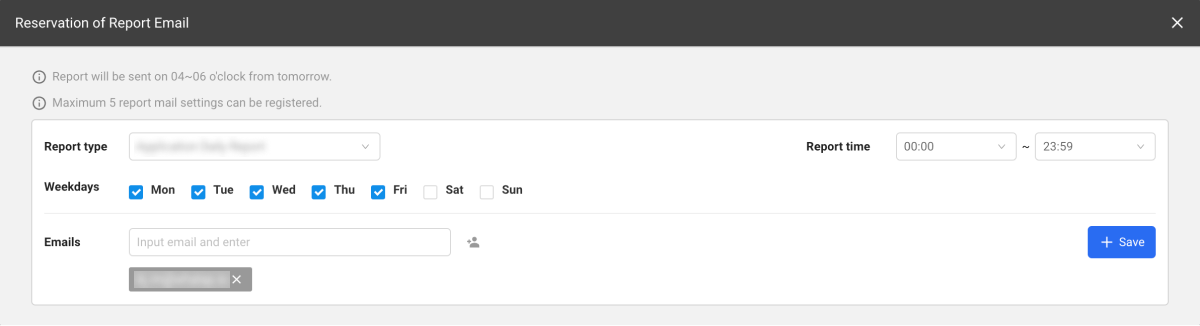
- To schedule a report transmission, select Reservation of Report Email.
Difference between the report and integrated report
Report menu generates a report for a single project. Accordingly, you can select a project and then access it through the report menu on the left. Integrated Report menu generates a report for multiple projects. It can be accessed through the main menu on the Home screen without selecting a project. For more information, see the following.
Select report type to create
You can check various reports related to Kubernetes. The report types provided by WhaTap Kubernetes are as follows:
- Daily Application Report
- List of Transactions exceeding the Threshold by Application Type
- Daily Metric Trend Status
- Daily Application Error Statistics Report
- Weekly Application Report
- Monthly Application Report
- Daily CPU/Memory Report by POD
- Weekly CPU/Memory Report by POD
- Daily Server Report
- Weekly Server Report
- Monthly Server Report
Email delivery schedule
To receive regular reports by email, select Reservation of Report Email. You can replace various service checking tasks performed right after work with email confirmation.