Setting the Kubernetes agent options
-
When releasing the WhaTap Kubernetes agent, it can be set through the container
envfield. -
It can be configured by modifying the whatap.conf file in the container.
-
The options in the whatap.conf file have higher priority than those set in the container
envfield. -
If no value is set in whatap.conf or container
env, the default value is used.
Setting the application agent options in the container
Configure necessary settings in whatap.conf for monitoring applications such as Java, Python, and Node.js in the container. For more information about available options in whatap.conf, see the following links:
Configuring the options for each container
whatap-node-helper
-
collect_volume_detail_enabled bool
Default
trueIn the node agent, use the
exec dfcommand for all containers to enable searching the container volume information. It enables the function to collect storage usage and volume data for all containers running on the node. -
inject_container_id_to_apm_agent_enabled bool
Default
trueIt enables container ID injection using
execin the WhaTap APM container. It automatically extracts the ID of the container identified by the WhaTap APM. You can inject this into the APM tool to associate the performance monitoring data with containers. -
debug bool
Default
falseSet whether or not to enable the debugging mode. Set the log level to
DEBUGwhen the debugging mode is enabled, otherwise toINFO. -
kube_config_path string
Default
~/.kube/configSpecify the Kubernetes configuration file path. If not set, use ~/.kube/config.
-
log_sys_out bool
Default
trueSet the log system output. When the option value is set to
true, logging is left simultaneously in the standard output (stdOut) and a file. Any changes are immediately reflected in the logging system. -
collect_kube_node_process_metric_enabled bool
Default
trueIt is the flag to enable or disable the monitoring for Kubernetes-related processes on the node. If it is set to
true, monitoring is enabled. If it is set tofalse, monitoring is disabled. -
collect_kube_node_process_metric_target_list list
Default
"kubelet,containerd-shim,containerd,docker,dockerd,crio,metrics-server, coredns,aws-k8s-agent,kube-proxy"Basically, it monitors Kubernetes-related processes. Users can arbitrarily set the processes to monitor by modifying the process list.
NoteList of default monitoring target processes by WhaTab
-
kubelet
This controller runs on each node, continuously monitors containers and communicates with the Kubernetes master to make sure that workloads are scheduled and run correctly. It is responsible for checking container status and managing node resources.
-
containerd
It is a high-performance container runtime for running containers. It handles image management, container creation and execution, networking, and such.
-
dockerd
It is the main process that manages the creation of Docker containers. This process includes building, releasing, running, networking, and data management for container images.
-
crio
It is a lightweight container runtime designed for Kubernetes that implements the Container Runtime Interface (CRI) to efficiently manage container workloads.
-
coredns
This process provides DNS services in the Kubernetes cluster and handles name resolution for services in the cluster. It also performs service discovery and load balancing, and supports seamless communication between services in the cluster.
-
aws-k8s-agent
This agent manages Kubernetes network interfaces (VPC CNI) in the AWS environment. This process allocates and releases AWS network resources (ENIs) for inter-Pod communication. If a problem occurs, it may cause network connection failures or resource allocation errors.
-
kube-proxy
This process for routing network traffic is performed in the Kubernetes cluster. This process runs on each node and enables communication between services and Pods. It also uses Linux networking technologies like iptables or IPVS to deliver the cluster's internal requests to the correct Pods. This enables service discovery and load balancing in the Kubernetes cluster.
-
kube-apiserver
This Kubernetes API server is a central component that handles all requests in the cluster and manages the status of resources. It processes all requests in the cluster, including authentication, authorization, and admission control.
-
etcd
It is a distributed key-value database that stores Kubernetes cluster status data. It plays an important role in saving and recovering the status of the cluster.
-
kube-controller
This process manages and runs multiple controllers, maintains the status of cluster resources, and performs automated tasks. It performs various roles such as managing node and Pod status, maintaining replication, etc.
-
kube-scheduler
It places Pods on appropriate nodes in the cluster. It selects an optimal node considering the Pod's requirements and the status of each node.
-
whatap-node-agent
-
shutdown bool
Default
falseForcibly disconnect the collection server. This means stopping communication.
-
license string
Agents are identified using the license issued to the project.
-
whatap.server.host string
Default
13.124.11.223or13.209.172.35Set the IP of the collection server. In case of
delimiter, use/:. -
whatap.server.port number
Default
6600Set the data receiving port of the collection server.
-
ONODE_NAME string
Default
NODE_NAMEorNODE_IPenvironment variable valueSet a name to identify the agent node.
-
tcp_connection_timeout number
Default
3000Set the timeout time when connecting whatap-master-agent to the collection server socket.
-
tcp_so_timeout number
Default
60000Set the data sending/receiving timeout time after socket connection.
-
debug bool
Default
falseSet whether or not to enable the debugging mode.
-
gpuEnabled bool
Default
falseSet whether or not to enable the GPU monitoring.
-
count_interval number
Default
5000Set the cycle to transmit metrics (
kube pod,container) to the collection server. The unit of the default value is ms.NoteThis option may affect the on-screen data refresh cycle. For more information, see Screen components affected by each metric.
-
collect_interval number
Default
5000Set the cycle for the agent to request apiserver to collect metrics (
kube_pod,container).NoteThis option may affect the on-screen data refresh cycle. For more information, see Screen components affected by each metric.
-
collect_apiserver_metric_by_leader bool
Default
falseIf the option is enabled, the node agent delegates metrics collection to the master agent. It requires to enable the
collect_apiserver_metric_by_leaderoption of whatap-master-agent first. Through metric collection delegation, the apiserver load generated by the existing whatap-node-agent can be reduced.
whatap-control-plane-helper
-
port string
Default
9496Set the web server port of whatap-control-plane-helper.
-
cycle number
Default
5Set the cycle at which the control-plane-helper scrapes metrics. The unit of the default value is s.
-
collect_control_plane_monitoring_enabled bool
Default
falseIt determines whether or not to enable the control-plane-monitoring function.
-
kube_config_path string
Default
~.kube/configSpecify the Kubernetes configuration file path. If not set, use ~/.kube/config.
-
kube_master_url string
Default
~/.kube/configSet the URL of the control-plane to request for scraping. If not set, use ~/.kube/config.
-
debug bool
Default
falseSet whether or not to enable the debugging (logging) for whatap-control-plane-helper.
-
kube_client_tls_verify bool
Default
trueIf the option value is set to
false, TLS authentication is not enforced and the authentication process can be skipped.
whatap-master-agent
-
shutdown bool
Default
falseForcibly disconnect the collection server. This means stopping communication.
-
license string
Agents are identified using the license issued to the project.
-
whatap.server.host string
Default
13.124.11.223or13.209.172.35Set the IP of the collection server. In case of
delimiter, use/:. -
whatap.server.port number
Default
6600Set the data receiving port of the collection server.
-
tcp_connection_timeout number
Default
3000Set the timeout time when connecting whatap-master-agent to the collection server socket.
-
tcp_so_timeout number
Default
60000Set the timeout time when connecting whatap-master-agent to the collection server socket.
-
debug bool
Default
falseSet whether or not to enable the
DEBUGlevel logging in whatap-master-agent. -
collect_apiserver_metric_by_leader bool
Default
falseSets whether or not to enable whatap-master-agent to act as the leader of the scraper. When enabled, whatap-master-agent alone requests metrics to apiserver.
-
collect_control_plane_monitoring_enabled bool
Default
falseSet whether or not to enable the control-plane monitoring.
-
master_to_control_plane_connection_timeout number
Default
5000Set the time until a connection timeout occurs when whatap-master-agent communicates with whatap-control-plane-helper. The unit of the default value is ms.
-
master_to_control_plane_read_timeout number
Default
20000Set the time until a read timeout occurs when whatap-master-agent communicates with whatap-control-plane-helper. The unit of the default value is ms.
-
control_plane_debug bool
Default
falseSet whether or not to enable all debug logging in whatap-master-agent for control-plane monitoring.
-
store_k8s_object_manifest_enabled bool
Default
trueSet whether or not to enable the Object Manifest collection. When enabled, manifest information for cluster objects is collected once a day.
-
store_k8s_object_manifest_timezone string
Default
UTCSet the time zone for collection of object manifests. If there is no separate setting, collection starts at midnight based on UTC by default.
For example, to run it at midnight in Korean time, set the time zone to
GMT+9orAsia/Seoul. -
store_k8s_object_manifest_max_fetch_limit number
Default
50Set the view number of objects to collect at a time. If there is no separate setting, 50 items are requested upon request based on the default value of
50.For example, when setting the option
30in a cluster with a total number of Pods of 90, pods are requested 3 times for 30 pods each.
Screen components affected by each metric
kube_pod
-
Dashboard > Container Map
The Pod view reference data in the following example image is affected by the
kube_podmetrics collection cycle and collection server transmission cycle.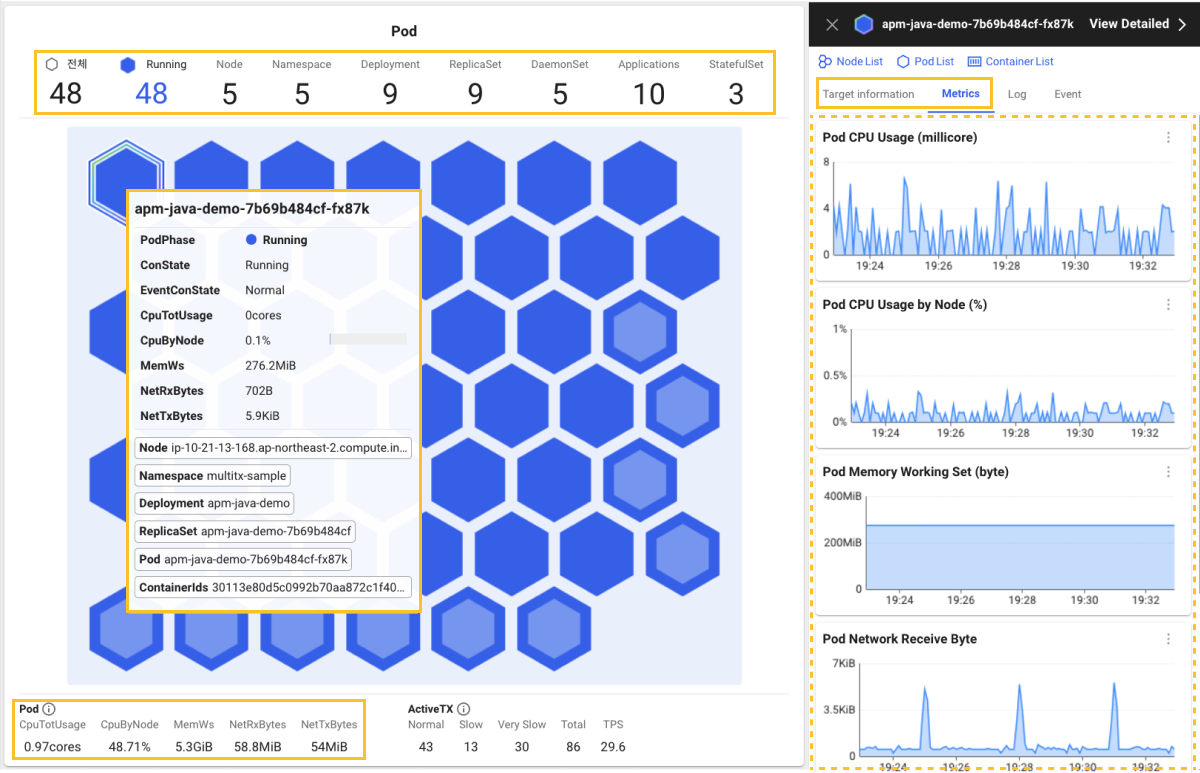
-
Workload > Pod List
The following example data is affected by the
kube_podmetrics collection cycle and collection server transmission cycle.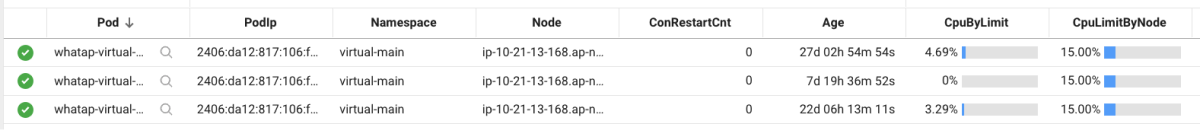
-
Dashboard > Performance Summary
It is affected by Number of pods running on nodes with agents chart update cycle using the
kube_podmetrics.
container
-
Dashboard > Container Map
In the following example, the screen data refresh cycle based on the container view is affected by the
containermetrics.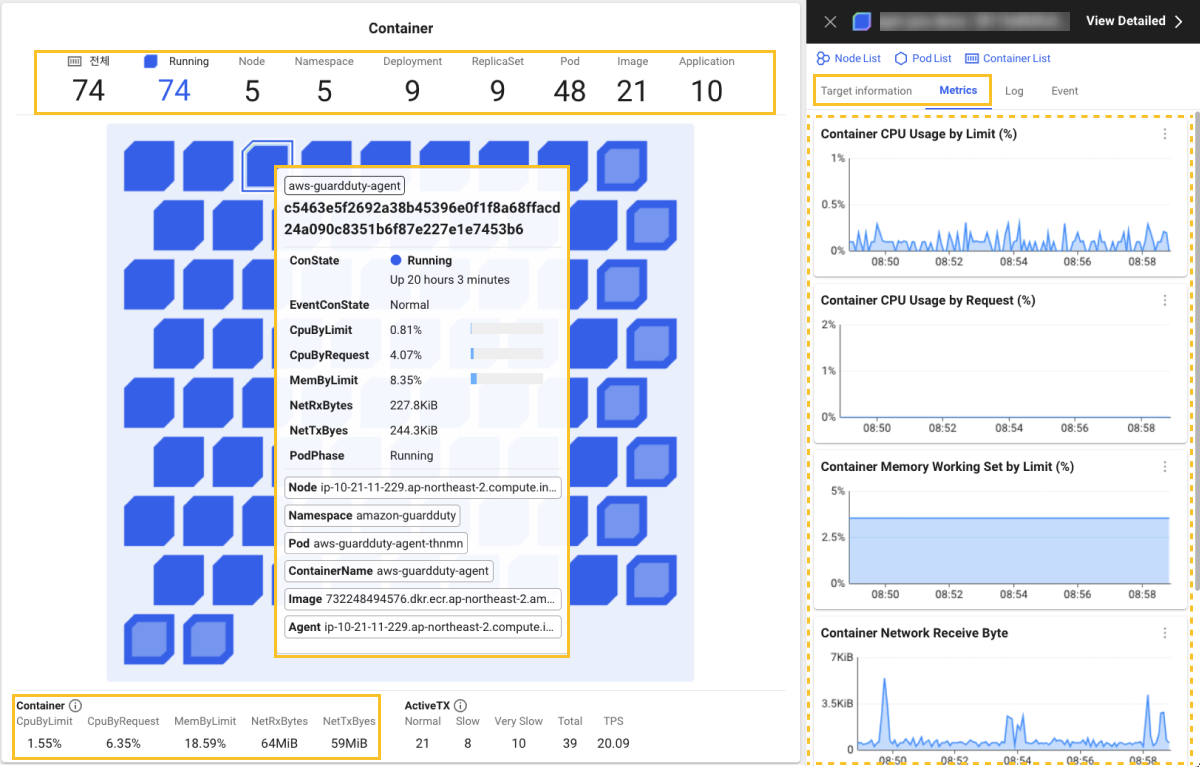
-
Container > Container Images
The data in the following example is affected by the
containermetrics.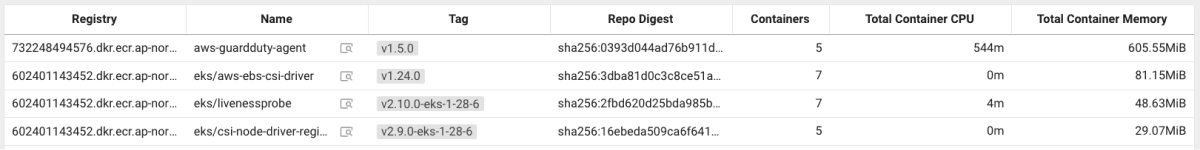
-
Dashboard > Performance Summary
It is affected by the update cycle of the following charts using the
kube_podmetrics.-
Number of containers running on nodes with agents
-
Number of nodes with agents
-
Total Container CPU Request
-
Total Container CPU Usage
-
Node CPU
-
Node Memory
-
Container CPU Usage by Request
-
Container CPU Usage by Node
-
Container Memory Working Set by Request
-
Container Memory Failure Count
-
Container CPU Throttling Time
-
Container Network Receive Byte
-
Container Network Transmit Byte
-
-
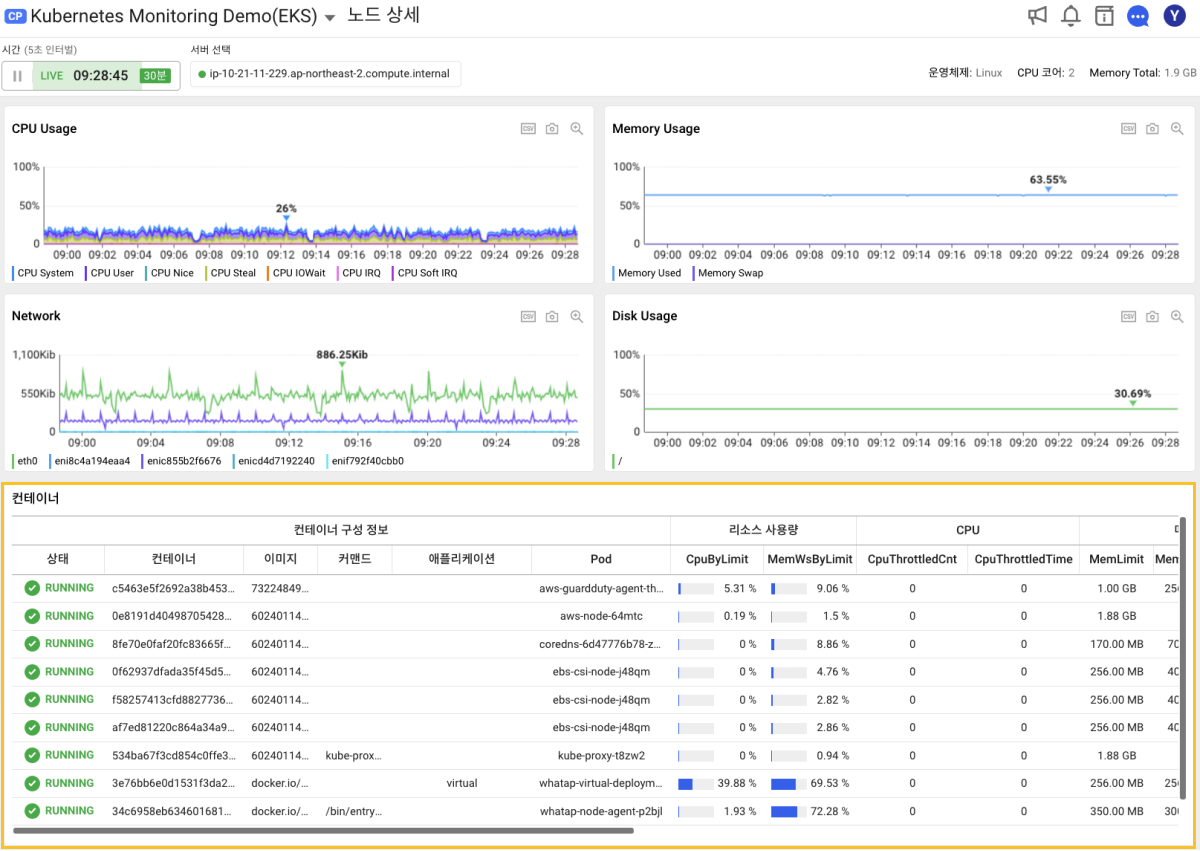
Cluster > Node Detail
In the following Node details screen as an example, the update cycle of the container list is affected by the
containermetrics.