Metrics
HomeProject > Select Project > Dashboard > Container Map > select a target and go to Detailed analysis > Metrics.
Kubernetes metrics
Kubernetes keeps an optimal state by continuously controlling and monitoring each container's resource usage. Accordingly, the process of checking resource usage and verifying the container resource usage setting based on that data is a basic pattern for Kubernetes monitoring.
CPU and memory metrics
Typical Kubernetes resource settings are the container's CPU request/limit and memory request/limit. The following is an example of configuration.
apiVersion: v1
kind: Pod
metadata:
  name: <Pod명>
spec:
  containers:
  - name: <Container 1 person>
    image: <Container 1 image>
    resources:
      requests:
        memory: "64Mi"
        cpu: "100m"
      limits:
        memory: "128Mi"
        cpu: "200m"
  - name: <Container 2 persons>
    image: <Container 2 images>
    resources:
      requests:
        memory: "128Mi"
        cpu: "250m"
      limits:
        memory: "256Mi"
        cpu: "500m"
With the above configuration, there are 2 containers in the pod. The resource settings for each container are as follows:
| Target container | Resource type | Resource setting | Value |
|---|---|---|---|
| Container 1 | CPU | Request | 100 m |
| Limit | 200 m | ||
| Memory | Request | 64 Mi | |
| Limit | 128 Mi | ||
| Container 2 | CPU | Request | 250 m |
| Limit | 500 m | ||
| Memory | Request | 128 Mi | |
| Limit | 256 Mi |
It is not easy to understand the resource configuration data and the current usage of various containers. Therefore, the WhaTap Kubernetes monitoring service provides the function to easily check the resource settings and current usage for a single container, selected multiple containers, or the overall deployment.
-
Detailed View screen > Metrics - Resource usage monitoring and analysis
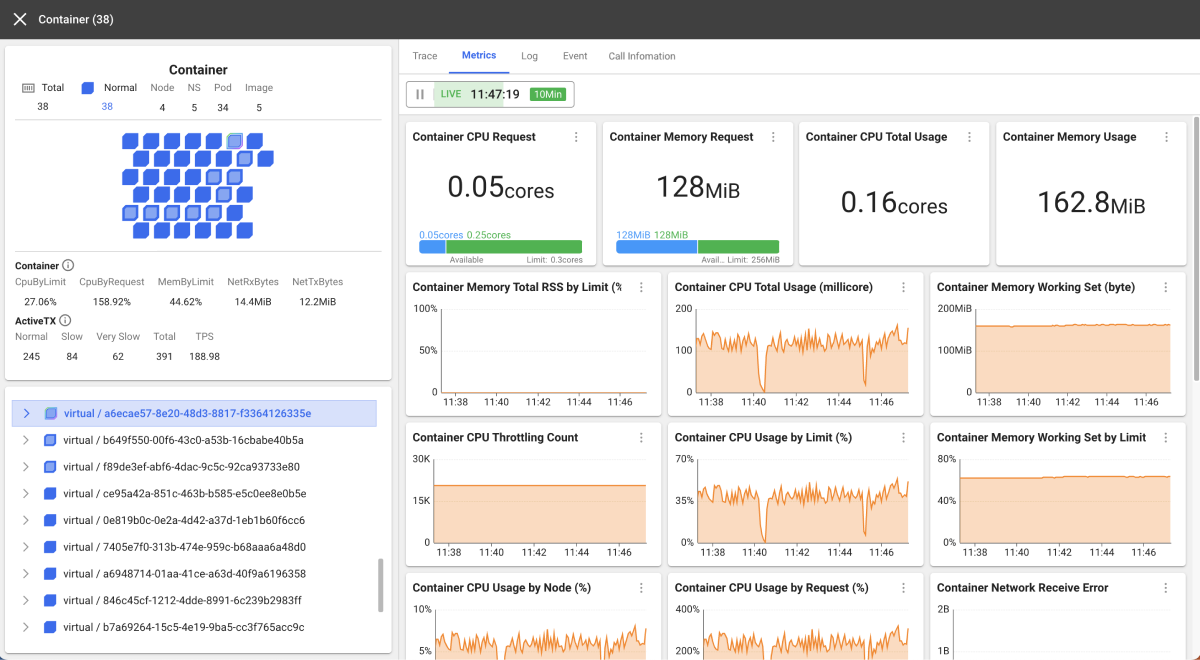
-
You can select a specific container to check its status.
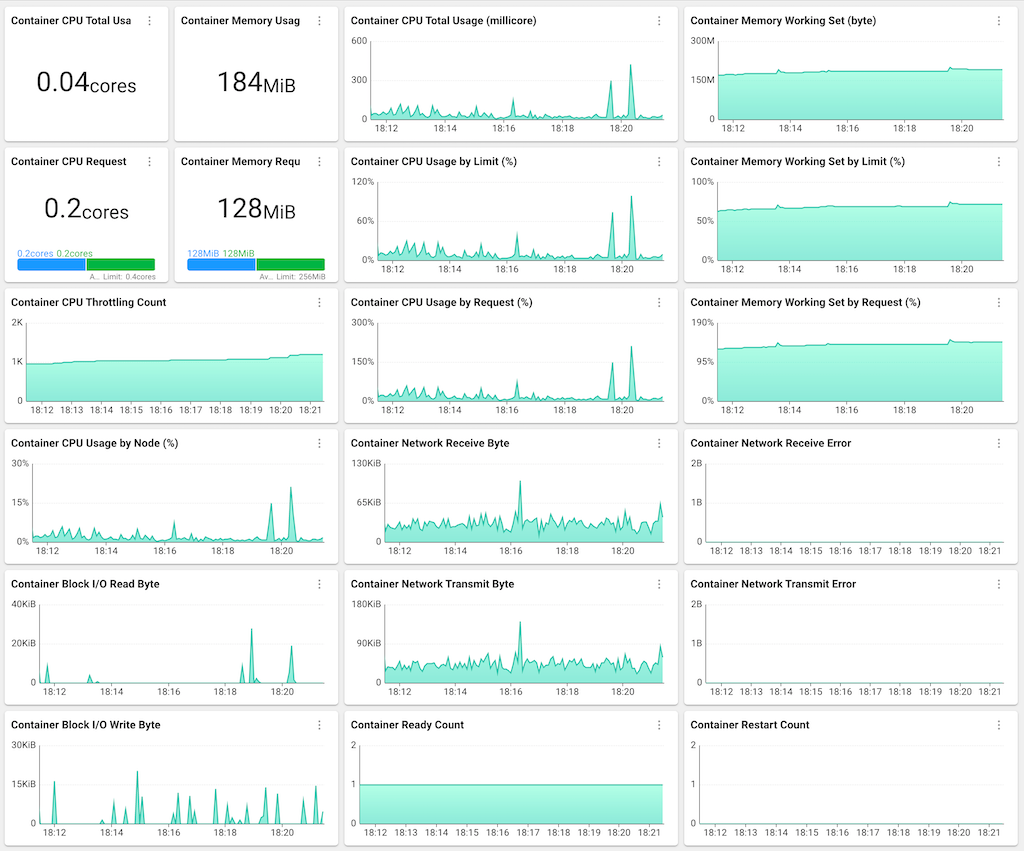
According to the above data, the CPU is set to Request 0.2 cores (200 m) and Limit 0.4 cores (400 m). The current CPU usage is 0.02 cores (20 m) (average for 5 seconds). If you check the CPU-related trend graph on the right, you can see that the CPU usage increases intermittently, although there is enough space.
The memory is set to Request 128 MiB and Limit 256 MiB. By the way, the current memory usage is 184 MiB. According to the memory-related trend graph on the right, it exceeded 100% on a request basis and is using more than 70% on a limit basis.
The main WhaTap metrics related to CPU and memory are as follows:
| Target resource | Shortname | Name | Description |
|---|---|---|---|
| CPU | CpuTotUsage | Container CPU Usage (millicore) | Container CPU utilization |
| CpuByRequest | Container CPU Usage by Request (%) | Container CPU utilization by request | |
| CpuByLimit | Container CPU Usage by Limit (%) | Container CPU utilization by limit | |
| Memory | MemWs | Container Memory Working Set (byte) | Container memory working set |
| MemWsByRequest | Container Memory Working Set by Request (%) | Container memory working set usage by request | |
| MemWsByLimit | Container Memory Working Set by Limit (%) | Container memory working set usage by quota |
If the node on which the pod is running has sufficient resources, it can use more resources than the request set in the container. Accordingly, among WhaTap metrics, the values for Container CPU Usage by Request (%) and Container Memory Working Set by Request (%) cannot exceed 100%.
For example, let's assume that the container's memory request has been set to 128 MiB. If the node of the active container (pod) has the total memory of 4 GiB and there has no pod on that node, this container can use more than 128 MiB of memory.
Other metrics
WhaTap provides various metrics other than CPU and memory.
-
Container Block I/O Read Byte (IoReadBytes)
-
Container Block I/O Write Byte (IoWriteBytes)
-
Container Network Receive Byte (NetRxBytes)
-
Container Network Transmit Byte (NetTxByes)
For more information about the WhaTap Kubernetes metrics, see the following.