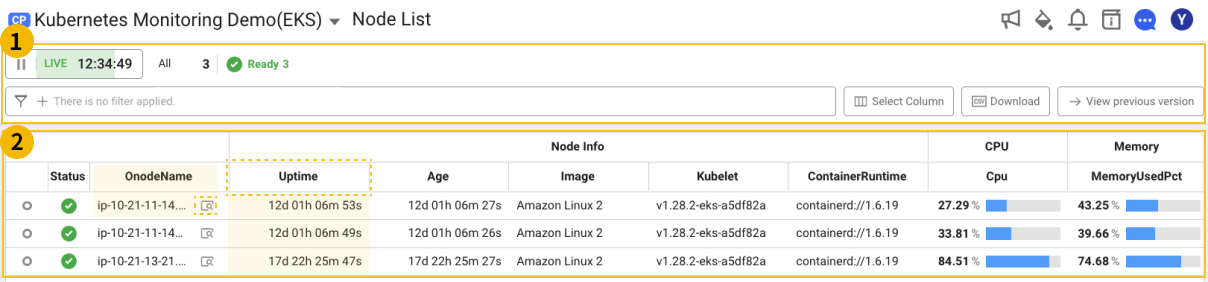
Node List
Home > Select Project > Cluster > Node list
If the data for specific columns does not appear, your Kubernetes node agent may be outdated. In this case, update the Kubernetes agent to the 1.3.7 or later so that enough data can be collected.
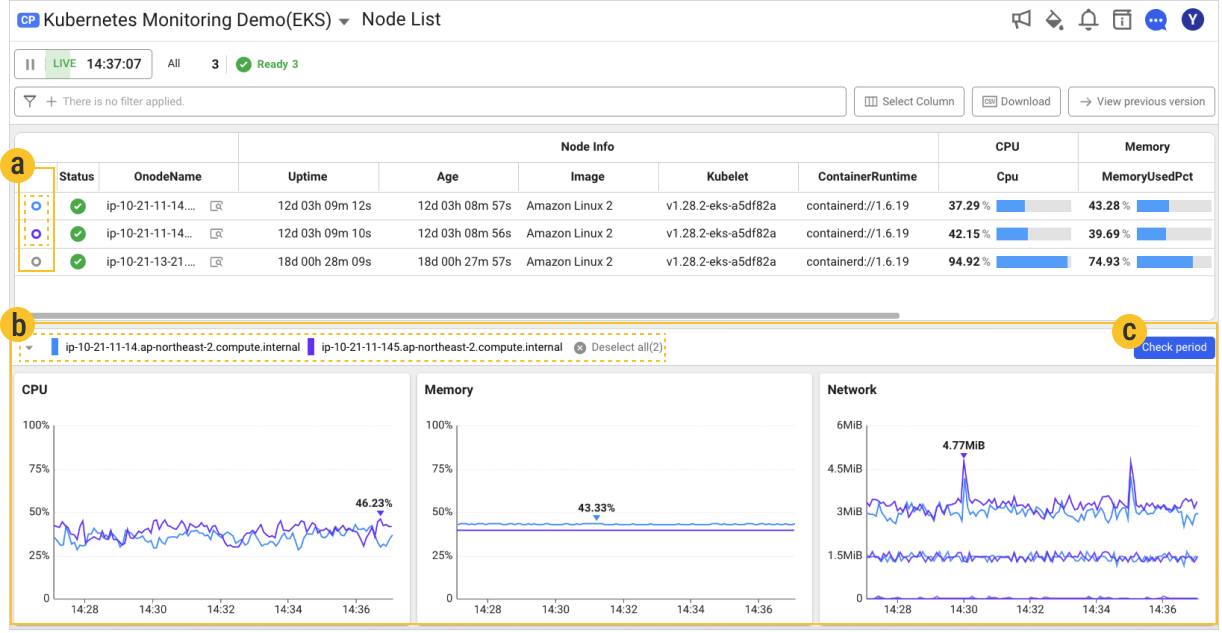
You can check the node information of the current project in a list.
-
Real-time data is updated every 10 seconds.
-
It provides the functions for node status summary, comparison, filtering, and CSV file download.
CSV file name, kubernetes_node_list_{pcode}{timestamp}.csv_
Basic screen guide
You can see data by selecting a desired option at the top of Node list.
-
You can see the number of all nodes and the numbers of nodes for each state.
-
If you select a desired column, you can search by sorting Node list based on the selected column.
Metric information
-
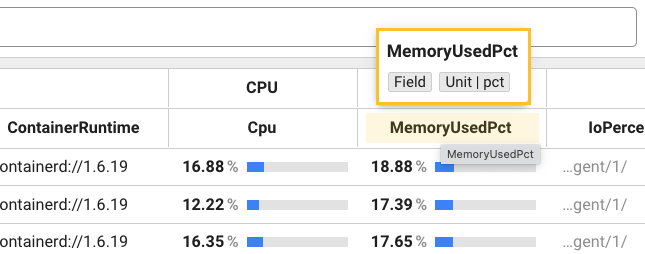
If you place your mouse cursor over the desired column, the metrics provided by the column are shown as follows:
-
In the column list of the Select Column option, you can see the metrics for each column in the column list of the option screen. When you place the mouse cursor over a desired column, the
 INFO icon appears to the right of the column name. If the mouse cursor is placed over the INFO icon, you can see the metric as follows:
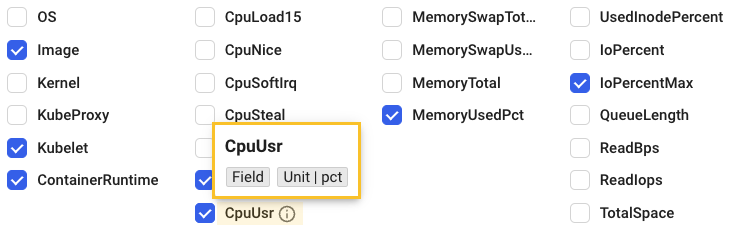
Filtering
By using the Filtter option, you can select a desired Node list for view. Through the and condition, multiple filters can be applied.
-
If you select
 Add icon in the
  Filter field, the Add filter window appears as follows:
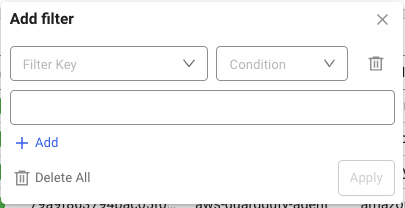
-
Select Filter Key and Condition.
-
Select a value that meets the conditions.
-
-
Configure a filter and then select Apply to apply the filter.
-
To add multiple filters, select
Add icon in the Filter field or Add filter window.
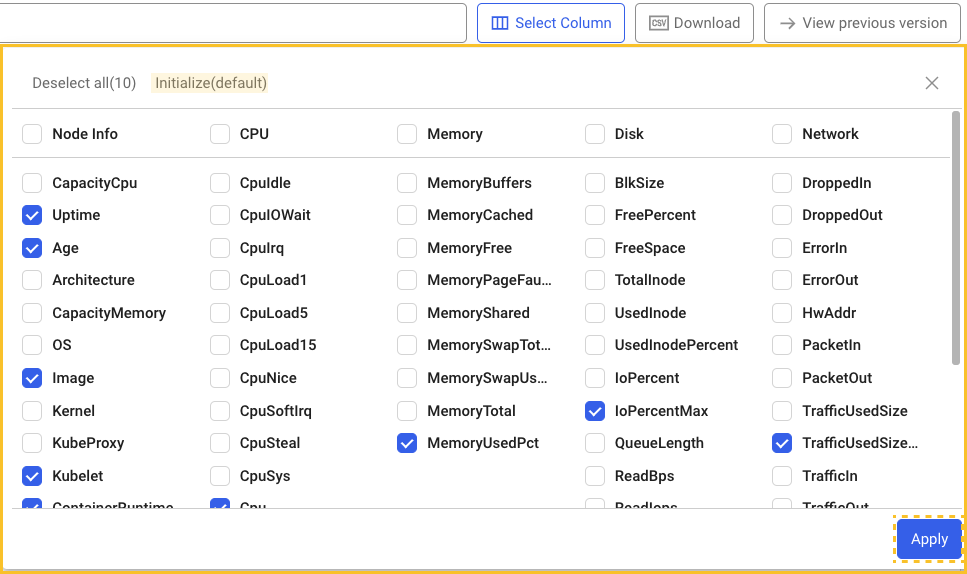
Select Column
When using the Select column option, you can select the desired Node data to view the list.
-
The selected column list is kept even if you re-enter the menu.
-
If you select Reset, the predefined default key metric columns are selected. In this case, the column selection history is deleted.
-
After selecting a column, you can click Apply at the lower right to apply the selected values.
Comparing
The Compare option allows you to see a comparison chart of key metrics for multiple nodes. When you select the Compare check boxes of the nodes to view in the list, a window comparing details for the nodes appears on the right as shown below.
View Detailed
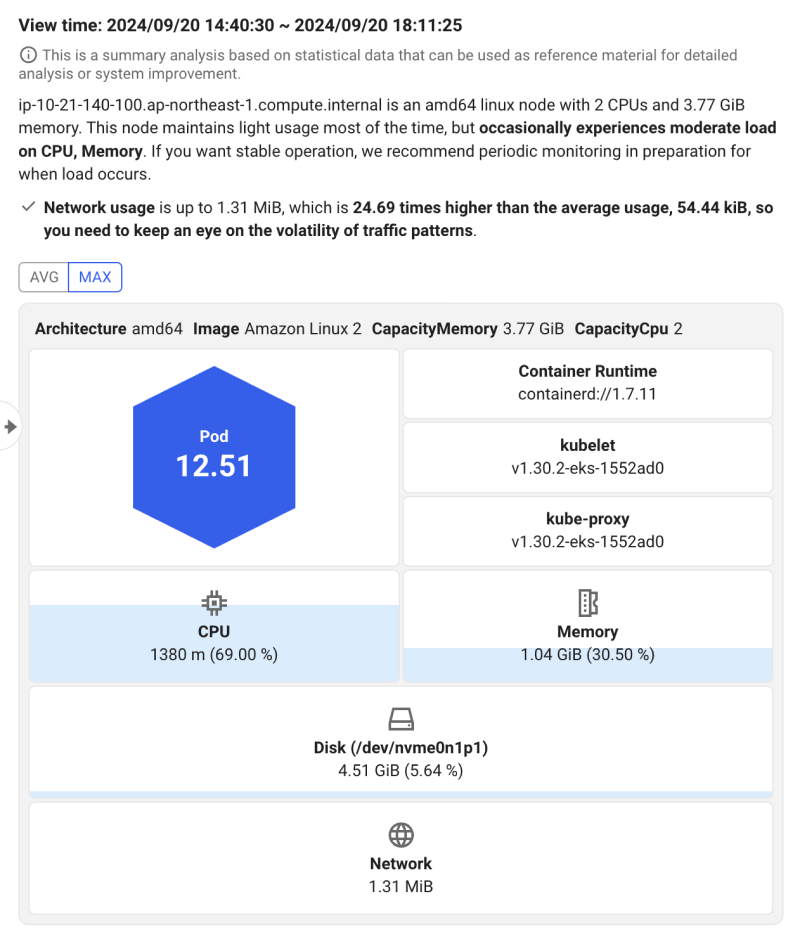
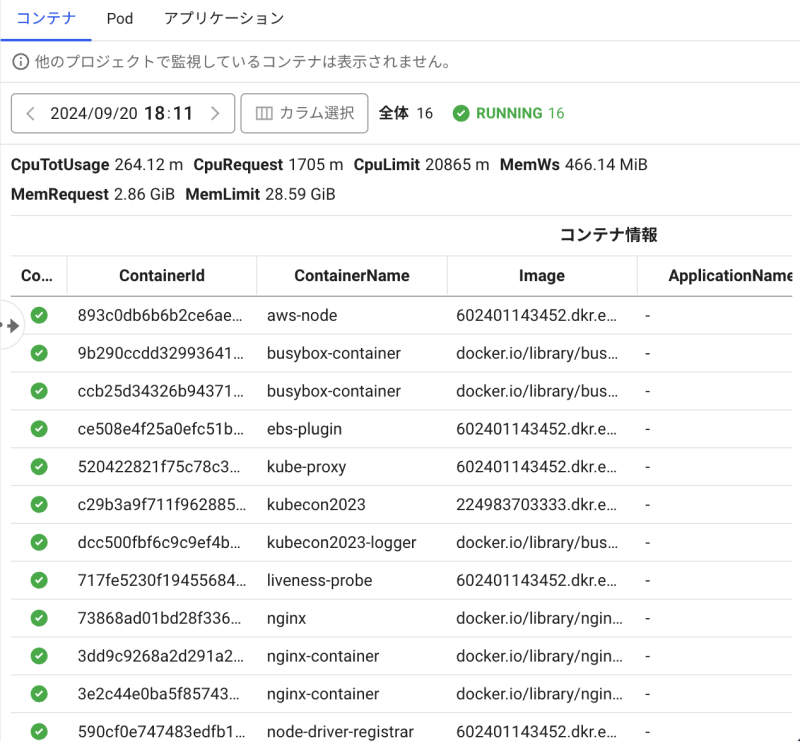
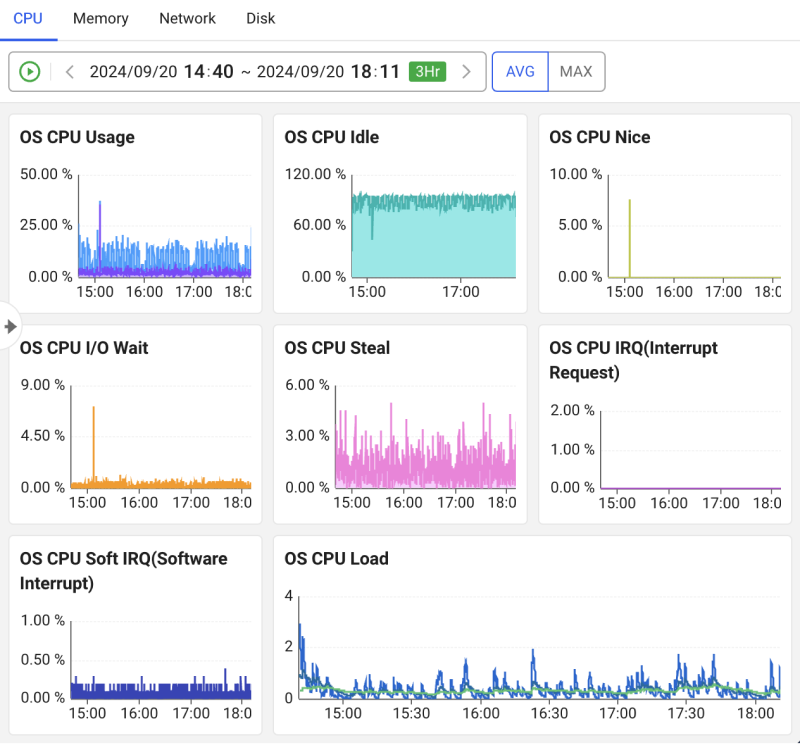
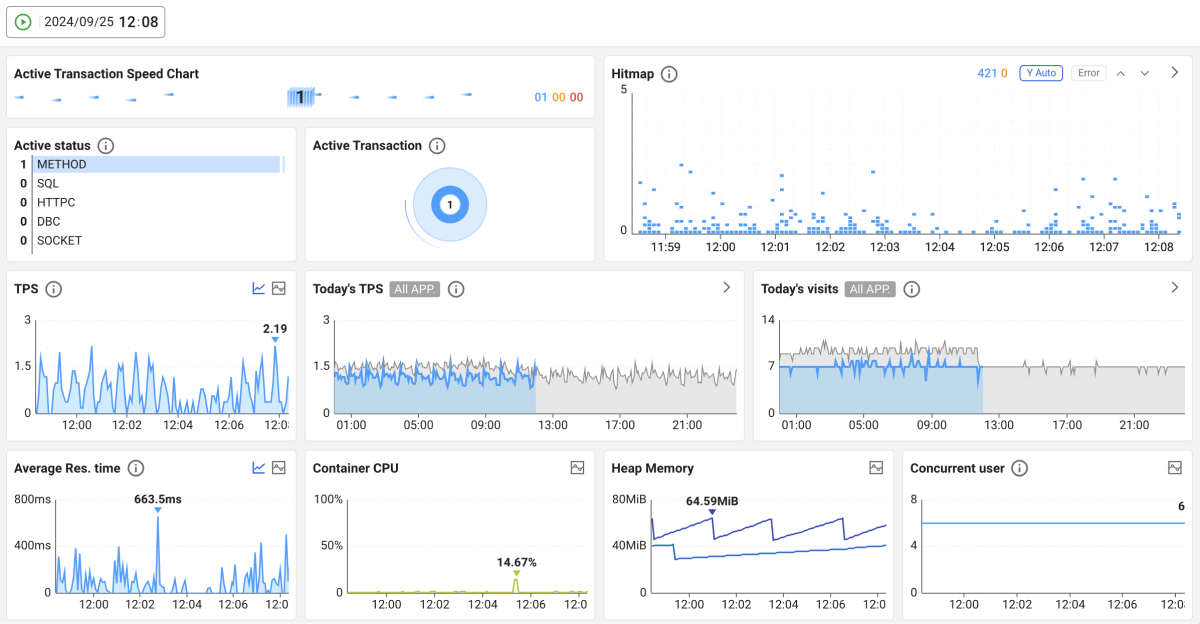
Node details can be checked through the Detail option for details on the selected node. If you select the It provides a summary of the node configuration and overall resource usage selected in theNode configuration tab. You can comprehensively see the hardware and software components of the node. Users can monitor resource usage of nodes and the status of each component, as well as performance and operational stability. Node system specifications Architecture: Hardware architecture used by the node. Image: Information about the operating system image that the node is running on. CapacityMemory: Total memory capacity of the node. CapacityCpu: Total CPU capacity of the node. Software configuration Container Runtime: Version of the container runtime used on the node. kubelet: Version of the Kubernetes kubelet running on the node. kube-proxy: Version of the kube-proxy that manages the network features. Resource usage status CPU: CPU usage of the node. Memory: Memory usage of the node. Disk: Disk capacity and usage rate on the node. Network: Network throughput If you click CPU, memory, disk, or network, the Metrics tab appears that can display the usage trend for the query period. By clicking AVG and MAX, you can see the average usage and maximum usage for the query period. The Node configuration tab is available in case of a cluster project ( Resource In the tab, you can see the list of Pods scheduled on the selected node and the containers and applications running in those Pods. The information appears reflecting 1 minute of resource data as of the end of the selected time zone. This allows you to more clearly identify the node status at the time point and the operation status of each Pod, container, and application. The Process tab provides information about the major Kubernetes management processes inside the selected node. It can prevent cluster failures caused by process issues and minimize the downtime. You can check information details about a process by selecting the You can select a method how to aggregate the statistical data during retrieval while querying long-term data of 3 days or more by clicking AVG or MAX. When you click a process key data value, the value is copied. The Process tab is supported in Kubernetes agent 1.7.14 or later. You can check the resource usage trend of the node select in the Metrics tab. You can check the usage changes in CPU, memory, network, and disk based on the average (AVG) and maximum (MAX) values during the query period. AVG: Average usage for the query period. MAX: Maximum usage for the query period. Total: Total traffic usage across multiple network interfaces. In/Out: Inbound (receiving) and outbound (sending) traffic usage for a specific network interface. The K8s CPU Request / Allocatable CPU (%) widget is supported in Kubernetes agent 1.7.10 or later. You can see the trace information of the applications running on the node selected in the Trace tab. You can check K8s Node events and WhaTap Node events that occurred on the node selected in the Event tab. K8s node events include important activity logs within the cluster such as changes in node status, while WhaTap node events provide information about the events triggered based on the user-defined alert criteria.![]() icon in the Detail column of the node to view in the list, the detailed information window for the node appears on the right.
icon in the Detail column of the node to view in the list, the detailed information window for the node appears on the right.Node configuration
CP).Resource
Process
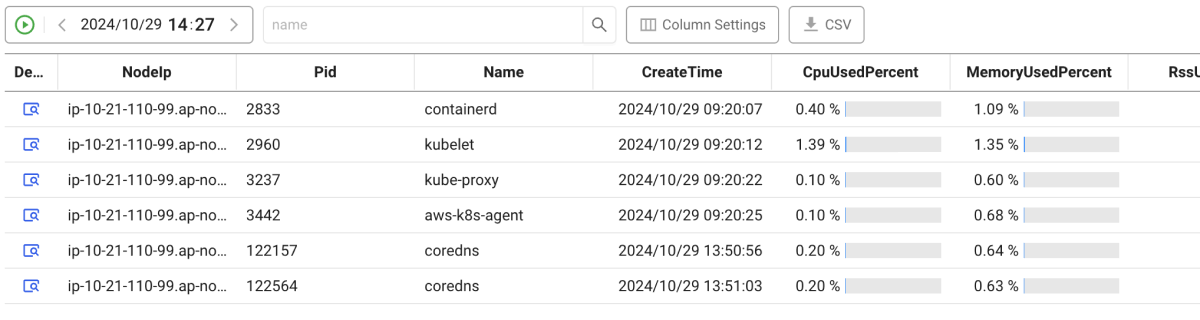
Process details
![]() icon in the Detail column on the left of the process list.
icon in the Detail column on the left of the process list.Metrics
Trace
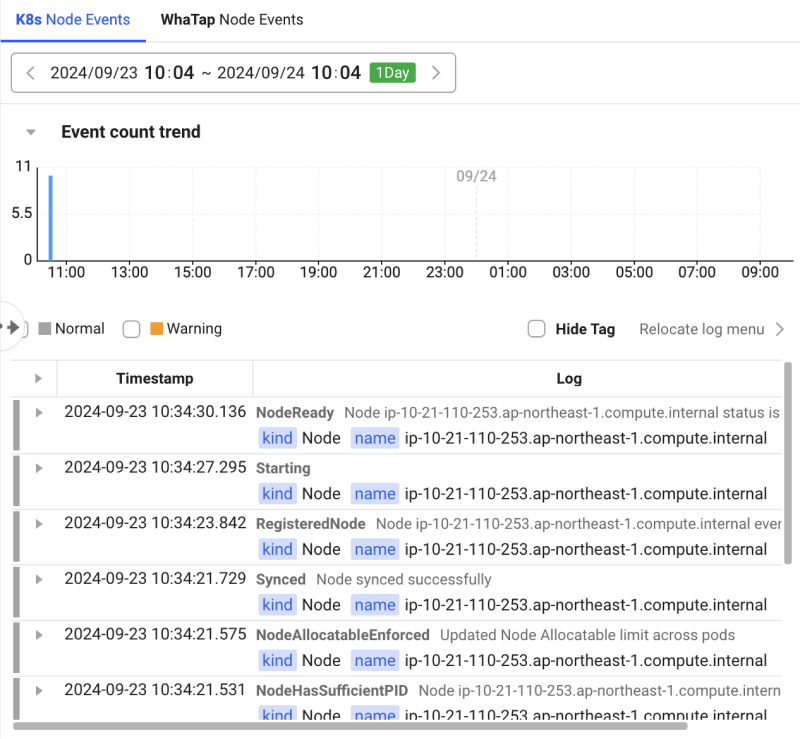
Event