Network performance monitoring
The Network Performance Monitoring (NPM) solution collects and visualizes network communication data for processes to identify any congestions and failures between networks and uses them to improve the network performance.
Needs for Network Performance Monitoring
Changes in network environment
Network monitoring must change from traditional equipment-centric monitoring to process-centric monitoring. In the past, network monitoring was operated by obtaining and visualizing data dependent on servers and network equipment through the SNMP protocol. Recently, the network market is growing in the framework for Cloud and Virtualization, which makes it difficult to determine failure situations and factors by existing monitoring methods.
-
Cloud
It is changing from an on-premise environment where services were operated through existing servers and network equipment to the environment where services are operated in a virtual environment provided by cloud service providers (CSPs). In the cloud environment where there are no physical entities, important monitoring targets are the processes that perform actual works.
-
Virtualization
In a container-based virtualization environment, multiple containers run on a single machine. Each container has an independent network stack, and communication between multiple containers exists on a single device. It is difficult to identify problematic containers and processes by the traditional equipment-based network monitoring.
Through Network Function Virtualization (NFV), the efforts to virtualize network functions implemented in existing independent hardware by using software are ongoing.
Cloud and virtualization have created gray zones that traditional network performance monitoring methods cannot trace. WhaTap NPM can respond to environmental changes for cloud and virtualization because it traces network behaviors for processes.
Increase in network complexity
Micro Service Architecture (MSA)-based services are increasing, and network relationships are becoming complex due to flexibility and scalability. Tasks to stabilize services, such as High Availability (HA) configuration or Scale Out, also affect the network complexity. As the relationship becomes more complex, the process of recognizing whether any load occurs and identifying each section becomes increasingly difficult.
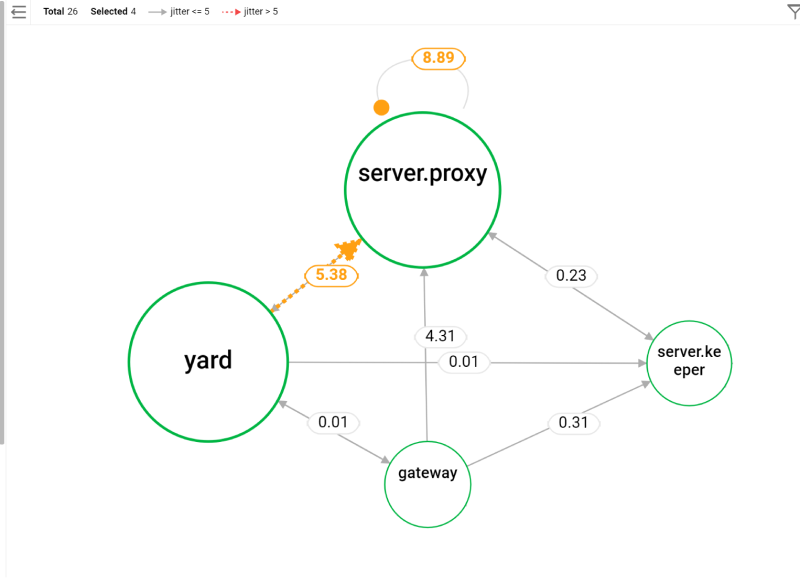
WhaTap NPM traces the network operations performed by each process and visualizes complex components and status intuitively through the topology.
Expected results
The following benefits can be expected through the metrics collected by process.
-
Network metrics monitoring at the process level
-
Identifying and improving the service dependencies
-
Network cost optimization
-
Reduced MTTD and MTTR for network failures
-
MTTD (Mean Time To Detect): Time taken to recognize a failure
-
MTTR (Mean Time To Repair): Time taken to recover from a failure after recognizing it
-
Main features
It groups complex networks to quickly monitor the performance metrics for each section. Through the topology dashboard that allows you to quickly respond to network failures, you can quickly identify network failures by using the grouped and simplified network information.
-
Reliable and detailed data collection
WhaTap NPM collects data by using the eBPF technology. The eBPF technology hooks various events occurring in the kernel and performs additional actions in the sandbox environment. Because it hooks kernel events, the detailed information at the process level can be obtained, and stable operation is possible as it is based on the sandbox.
-
Visibility via tag options
Network monitoring products can provide various complex network data for ease of understanding. WhaTap NPM supports the tag options to display network components according to your purpose and intention. Various customizations are possible according to the characteristics of customer services.
-
Troubleshooting through raw data
Even if you do not access a server, you can check the network status based on the metrics at a specific time point even after a failure situation has been resolved, and support to identify problems such as related servers and processes.
NoteFor more information about the menu that uses raw data, see the following.
-
Custom charts of various criteria through the Flex Board
Custom charts can be created based on various criteria through the collected data.
Guide to key metrics
The network performances are monitored through five network metrics.
-
Quality metrics
The latency and jitter metrics are provided as criteria for determining performance issues and failures. It can be collected while using the TCP-based network communication.
-
Latency: Metric that indicates the network response time. A high response time zone can directly provide a poor experience for end users.
-
Jitter: Metric that indicates the variability in network response time. A high Jitter value can be interpreted as network congestion in the zone and frequent changes in the packet moving path. Failure of a specific network zone can be suspected, and the order of packet arrival is distorted, resulting in packet retransmission, leakage, and poor overall service quality.
-
-
Network usage metrics
bps, pps, and session count provide the network usage data based on three things, and can be used to optimize the cloud environment through influx of unintended external traffic (DDoS, etc.) or traffic patterns.
-
bps: Metric that indicates bits per second (bps).
-
pps: Metric that indicates packets per second (pps).
-
session count: Metric that indicates the unique session count.
-
Guide to use metrics
-
Network metrics are better to have the target thresholds similar to the server's CPU usage.
-
For service reliability, SLI (Service Level Indicator) and SLO (Service Level Objective) must be defined and based on this, a specific level of service must be consistently provided.
-
If the target value is unclear, collect data based on the initial criteria provided by WhaTap, set the goal later, and then attempt to improve the service.
-
-
Currently, WhaTap applies default thresholds as follows. It can be changed according to user environment and SLO target value.
-
Jitter: 30 ms
-
Latency: 200 ms
-
bps: 128 Mib/s
-
pps: 50k
-
session count: 100
-
-
By applying the threshold to the topology, you can quickly identify the sections that have exceeded the threshold and support improvement decisions.
-
You can send a notification when each metric exceeds the threshold and check the event data.
-
For network metrics, a flat and horizontal chart is expected generally. The metrics that rapidly change from the mean value can determine failures and identify each section.