Container Map
Home > Select Project > Dashboard > Container Map
The Container Map in WhaTap Kubernetes is the starting point for Kubernetes monitoring. Depending on the custom view, each object represents a container or pod.
-
Using the container map, you can select targets to analyze and organize groups.
-
By setting the status metrics and thresholds, you can see the status of individual containers or pods at a glance.
-
You can select individual containers or pods for detailed information. It provides key monitoring data such as Trace, Metrics, Logs, and Event.
The following video clip is the guide to the Container Map menu.
Basic screen guide
 Go to Cluster Project - Namespace Project
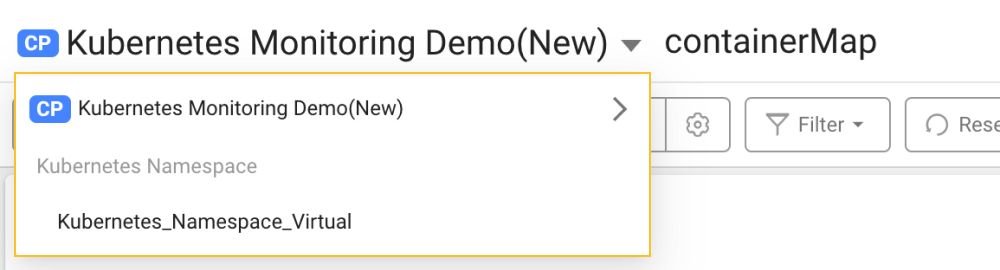
When a namespace project is created under the cluster project ![]() , if you select
, if you select ![]() More on the container map, a project list box appears. Through the project list box, you can see the project list including cluster projects and move between them.
More on the container map, a project list box appears. Through the project list box, you can see the project list including cluster projects and move between them.
For more information about the namespace project creation and management, see the following.
 User configuration

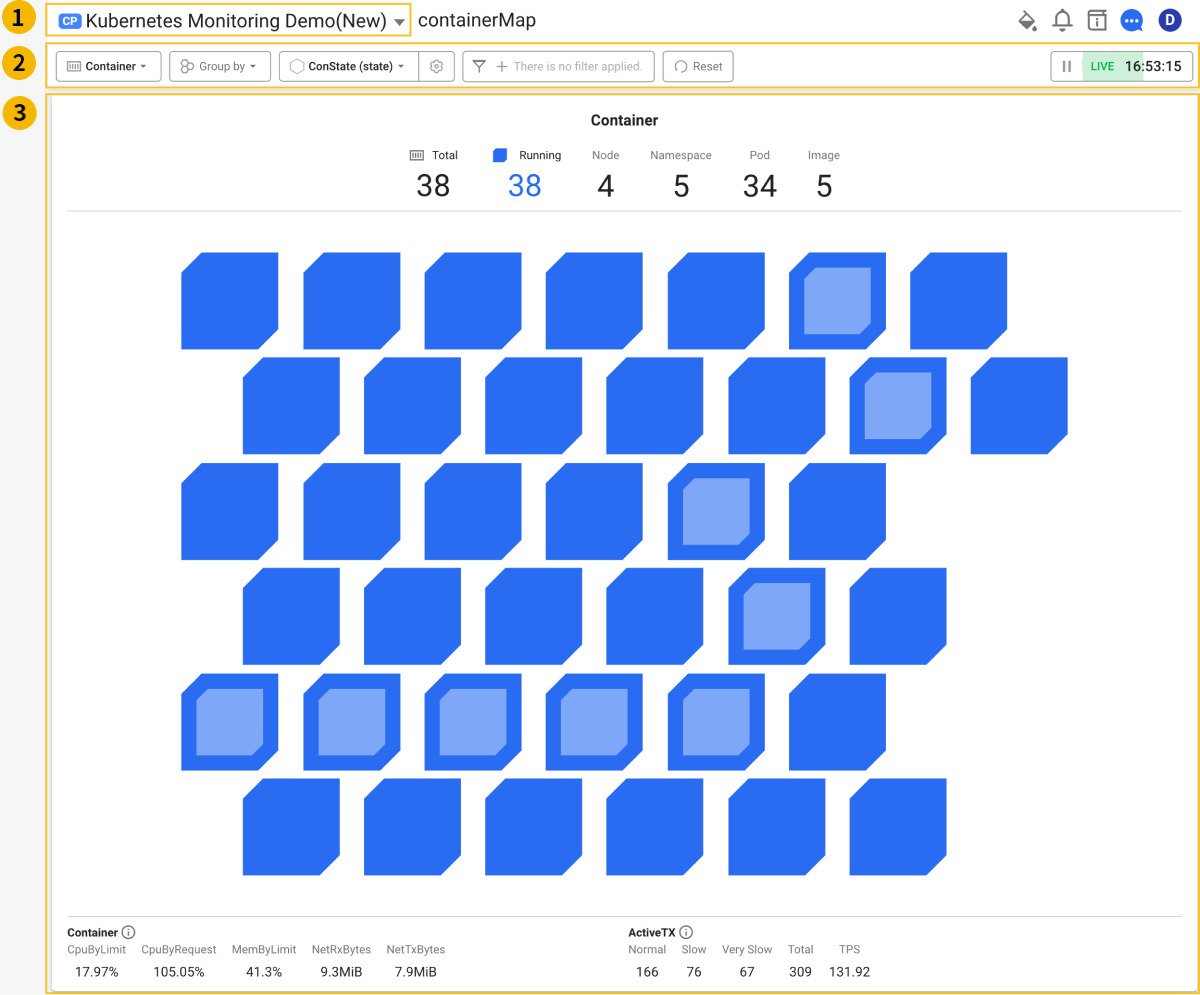
A container map provides multiple user settings that allow you to create any desired screen view. The functions available in the screen are as follows in order.
-
Category: You can select the targets to analyze. You can also set the container or pod.
-
Group by: Through the Group by (clustering) option, the hierarchical relationships between cluster components can be displayed in two levels. For more information, see the following.
-
ConState(state): You can select any chart metric.
-
If you click
 , you can select any option to display information of containers or pods on each object.
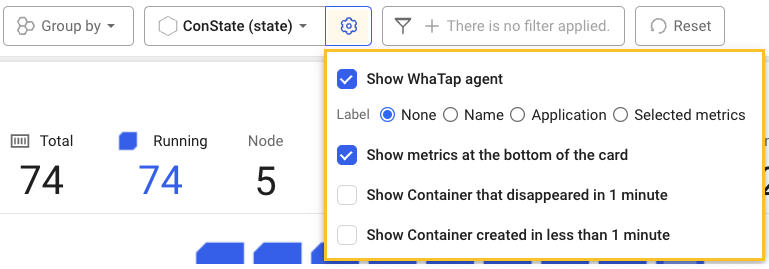
-
Show WhaTap Agent: The container or pod data can be displayed. Select a desired label option. For more information about the label option, see the following.
-
Show metrics at the bottom of the card: You can select whether or not to display the metrics information at the bottom.
-
Show containers or Pods created within 1 minute: Option to display containers or Pods created within 1 minute.
-
Show containers or Pods disappeared within 1 minute: Option to display containers or Pods that disappeared within 1 minute.
-
-
 Filter: You can see the status of containers or pods by filtering them based on your selections.
 -
 Reset: It initializes the screen view set by you.
Metric selection and threshold setting
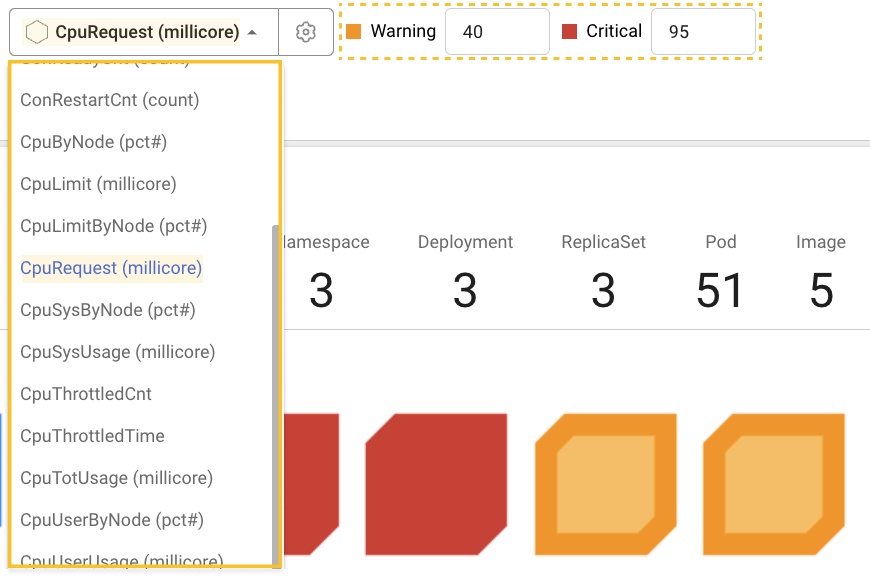
Chart metric selection and threshold setting determine the status on the container map. If the selected metric has numeric data, you can set thresholds. The set thresholds are displayed in color according to the following categories:
-
More than 0 and Less than Warning: Blue
-
More than Warning and Less than Critical: Orange
-
More than Critical: Red
-
Numerical metric units include pct (percentage), bps, millicore, and such. The pct# metric unit can have a value greater than 100%.
-
For more information about the chart metric selection and threshold setting, see the following.
Label options
-
None: Labels are not displayed in the block.
-
Name: The container or pod name is displayed.
-
Application: The application in the container or pod is displayed.
-
Selected metrics: The chart metric selected in ConState(state) is displayed.
Real-time and past search
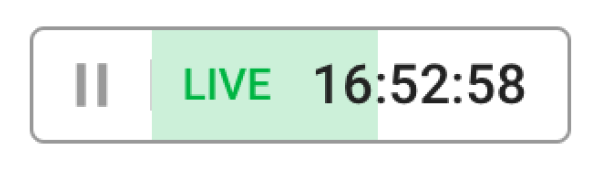
Container maps are based on real-time lookups based on multiple viewpoints. Use the time selector at the top left of the screen to change the real-time inquiry.
| Lookup status | Description |
|---|---|
| Real-time inquiry (LIVE) | Default mode Real-time status changes every 10 seconds. |
| Paused inquiry (PAUSE) | Real-time status change OFF Used to check the current status in detail. |
| Historical inquiry | You can specify a past time to check Year/Month/Day/Hour/Minute |
For more information on how to use the time selector, see the following.
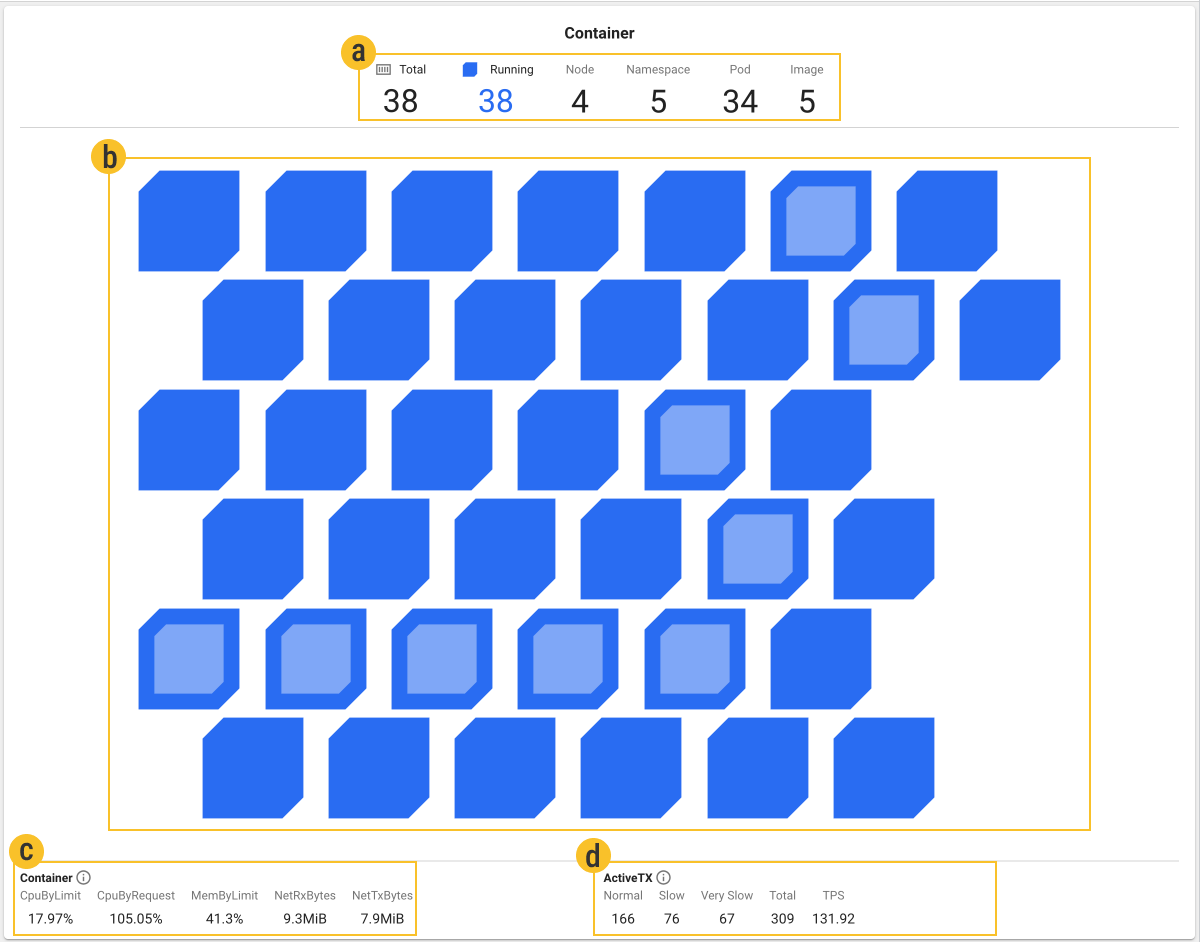
 Container map chart
-
 The total number of grouped targets and the key resource count are displayed.
 -
 The shapes and colors for each object display the characteristics and status for containers or pods.
-
Linking an external project
You can check external projects linked through logos within the block. For more information, see the following.
-
Color
It indicates the status of the container or Pod. For more information about the status other than Normal, Warning, and Critical, see the following.
-
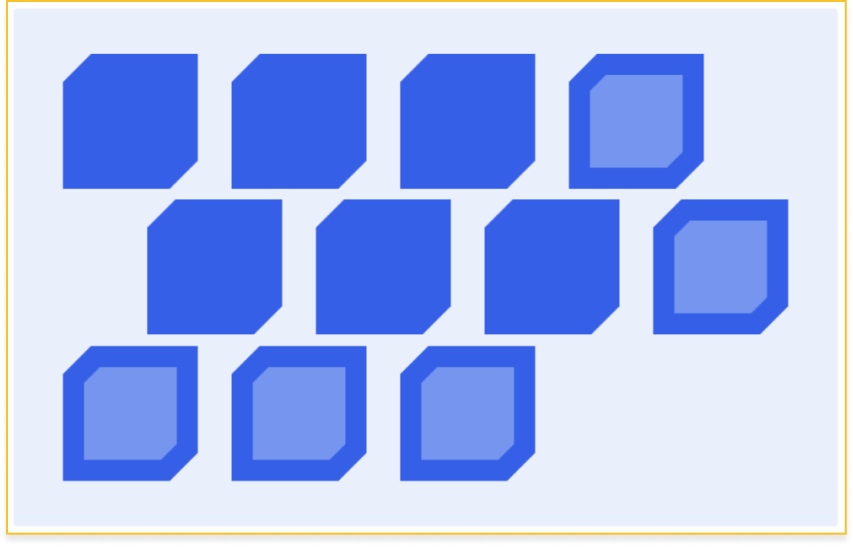
Outline
-
Some objects have borders. The targets are what have installed microagents like Java, Node.js, Python, and such in the container.
-
If there are 2 containers in a pod and the micro agents are installed on only 1 of 2 containers, the borders are displayed. In other words, if any of the containers in the pod have micro agents installed, the borders are displayed.
-
NoteBlock and micro block

In the Container map, the single polygon is called a block. At this time, the block with an agent (a block within a block) is called a micro block.
NoteGroup
When the entire block is selected on the Container Map screen, the multiple block is called a group.
-
-
 It displays the metrics related to the CPU and memories for the grouped targets.
 -
 It displays the transaction information for the applications in the grouped targets.
Container map targets
You can select an interested container or pod to view the summary and detailed information. The information includes the key monitoring data as follows:
-
Target Info
By clicking on a block, you can specify a target, to view the related resource information and navigate to the corresponding menu link.
-
Resource relations
It provides a relational chart that visually represents resource information related to the selected target.
-
Trace
If the WhaTap application agent has been installed in the container, it provides transaction trace information for the application so that you can check it in real time on the dashboard.
-
Metrics
The dashboard provides metrics such as CPU usage, memory usage, and network traffic of the selected container or Pod.
-
Log
It provides the standard output logs of each container and the logs generated and stored by containers and applications.
-
Event
It provides information on the events occurred in Kubernetes and WhaTap events.
-
Call Infomation
It provides a chart visualizing the call flow of the applications running in the selected container.
Based on these data, you can obtain the observability of the Kubernetes environment. Both the Display Summary and Detailed Analysis provide information based on the above 4 items.
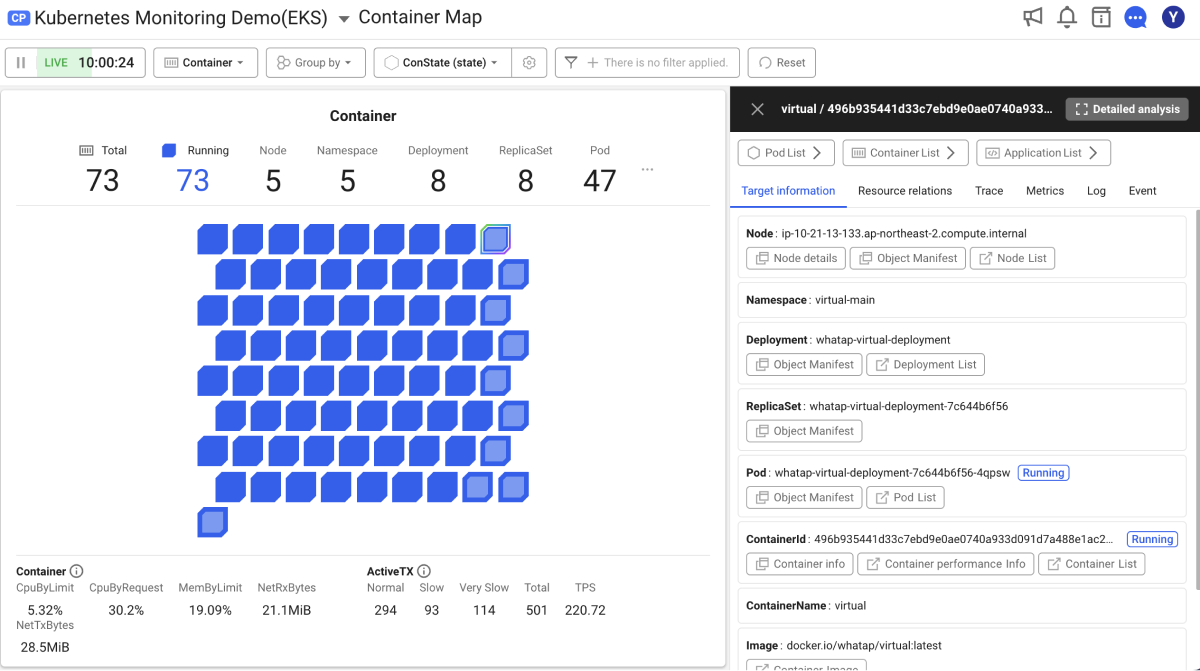
Summary view
Click a specific object or a set of objects on the container map. You can check the summary data of the object through the Display Summary screen that appears on the right.
-
Target Info
It provides basic information about the selected Pod or container. You can see basic target information such as the node on which the resource is running and the namespace it belongs to, and navigate to the list menu.
-
Node: You can check Node details, Object manifest, Node summary analysis and move to the Node list menu.
-
Deployment: You can check the Object manifest and go to the Deployment list menu.
-
ReplicaSet: You can check the Object manifest.
-
Pod: You can check the Object manifest and Pod summary analysis and go to the Pod list menu.
-
ContainerId: You can check the Container info and Container summary analysis and go to the Container list menu.
-
Image: You can check the container image and go to the Container image menu.
-
ServiceName: You can check the Object manifest and go to the Service list menu.
-
Resource relations
The Resource relationships tab of the container map allows you to visually see the connections between Kubernetes resources.
-
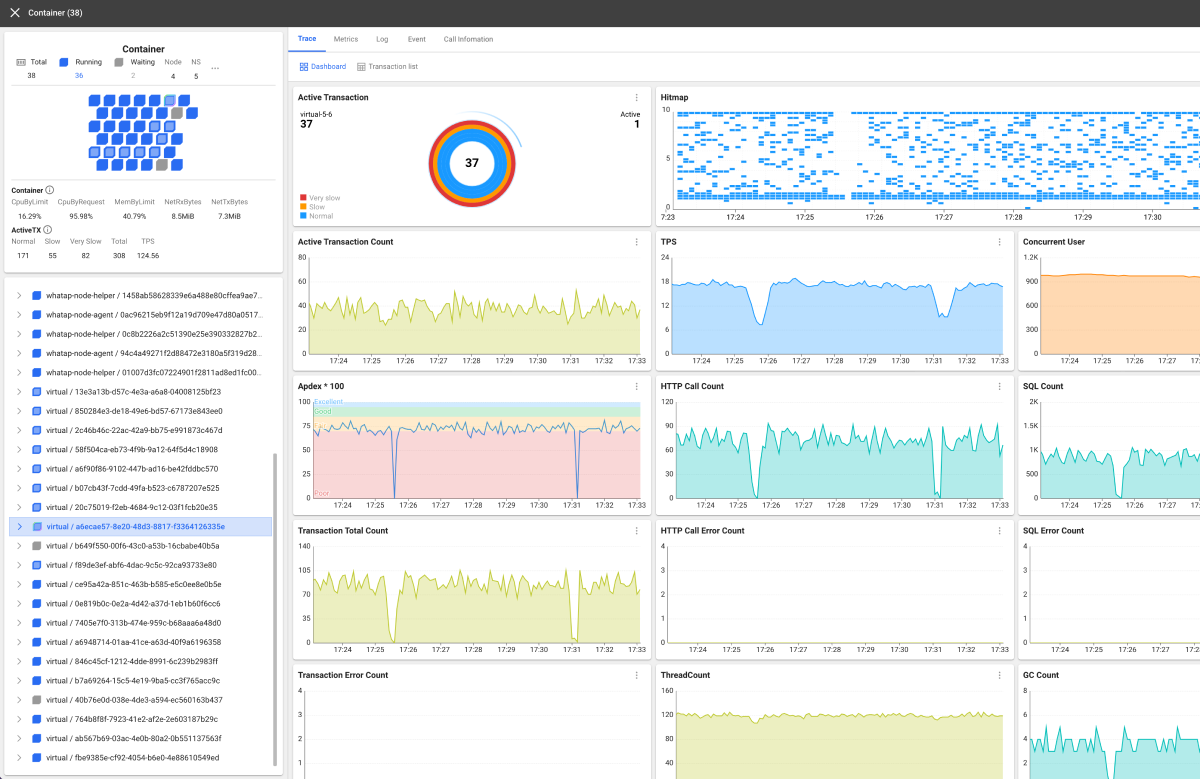
Trace
Under the Trace tab in the container map, you can trace each individual transactions of the applications running on the container.
-
Metrics
Under the Metrics tab in the container map, you can see various metrics data such as resource quotas and usages for each container in real time.
-
Log
Under the Log tab in the container map, you can manage and view standard logs for each container and application logs on the container.
-
Event
Under the Event tab in the container map, you can see integrated views for the events that occurred in the Kubernetes cluster and user threshold events based on the WhaTap's alert function.
-
Call Infomation
In the Call information tab of the container map, you can see the call flow of the applications running on Kubernetes containers and the status of outbound call targets.
Detailed analysis
On the upper right of Display Summary, click ![]() Detailed analysis. The Detailed analysis screen appears. For more information about the Detailed analysis screen layout, see the following.
Detailed analysis. The Detailed analysis screen appears. For more information about the Detailed analysis screen layout, see the following.
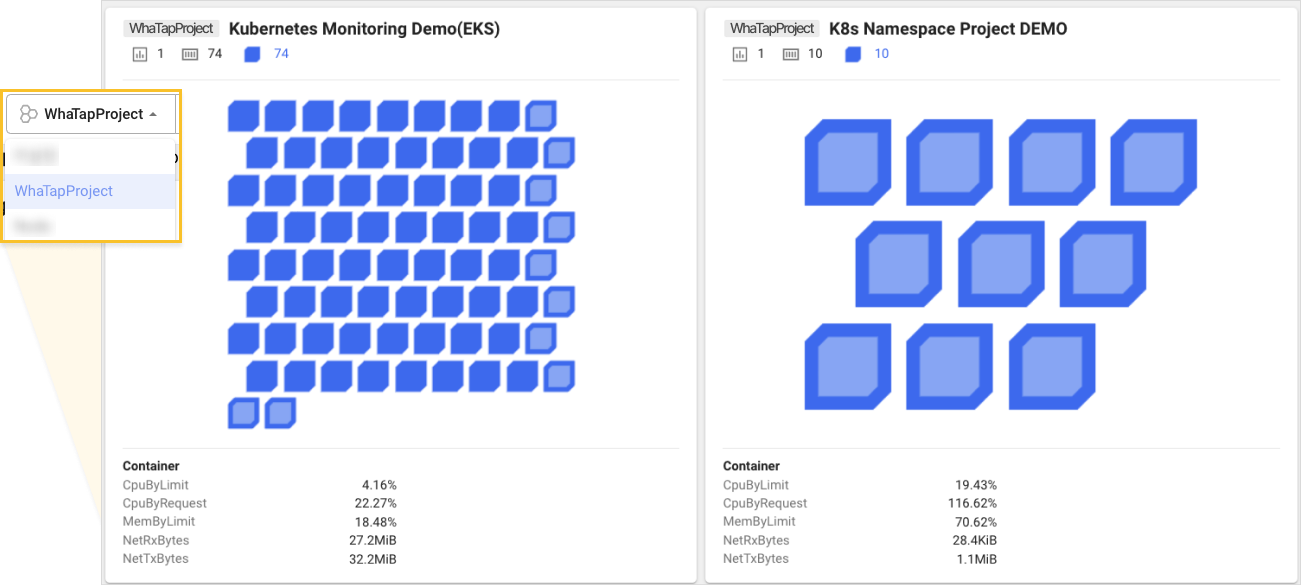
Integrated Container Map
Home > Select Project > Dashboard > Integrated Container Map
To view the container map including the cluster project (CP) and namespace project (Namespace), see the Integrated Container Map.
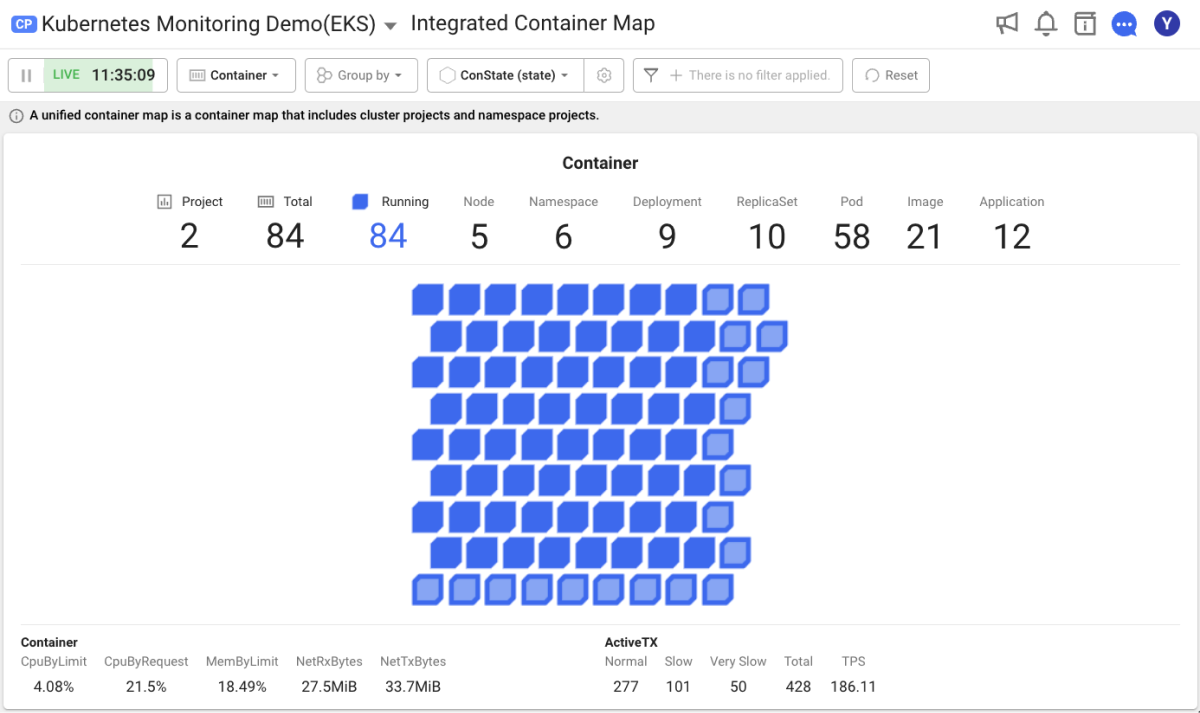
Integrated Container Map provides additional grouping options by project. Among the grouping options, the WhaTapProject grouping allows you to view the container map in the cluster project and namespace's individual projects on a single screen as follows.