Metrics
What is the metrics?
WhaTap collects data from the monitoring targets and provides them to users. The data collected by the agent is marked with metrics.
Metrics provides a baseline for viewing the user environment at a glance. For example, you can easily check the average memory utilization by server and average DB connection time through the list of source data or a visualized chart view. After finding any problem factor, you can see the detailed analysis through logs or traces.
Metrics also helps you scale the user environment. Determining the required amount of resources through the resource usage statistics is important in terms of performance improvement and cost effectiveness.
WhaTap's metrics collection
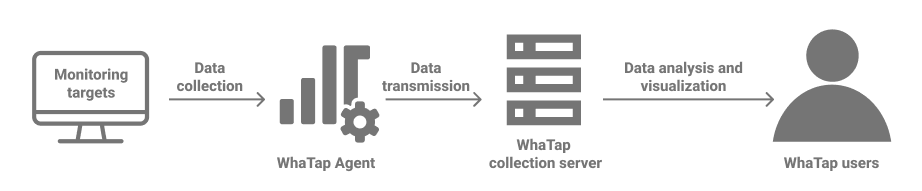
The WhaTap agent collects monitoring metrics from the monitoring target and sends them to the WhaTap collection server in the form of metric data. The WhaTap collection server stores and manages the related data by category.
WhaTap's collection server collects metrics from various monitoring targets. Users need to go to the corresponding product-specific guide screen and then follow the provided process to access the desired metric.
For example, to start Kubernetes monitoring, you need to install the WhaTap agent first. See the following. For more information about the related metrics, see the product-specific page.
WhaTap's metrics elements
WhaTap's metric consists of the following components:
- Category: It means a key to identify units that bind the related metrics.
- Tags: Data containing unique identifiers to find the targets to collect. It stores items such as IP, Oname, and host that rarely change. Multiple tags exist in the form of map.
- Fields: It stores all metrics collected from the agent. Multiple fields exist in the form of map.
- Time: Time when the metric has been collected.
- Oid: Unique number of the agent that has collected metrics.
- Oname: Unique name of the agent that has collected metrics.
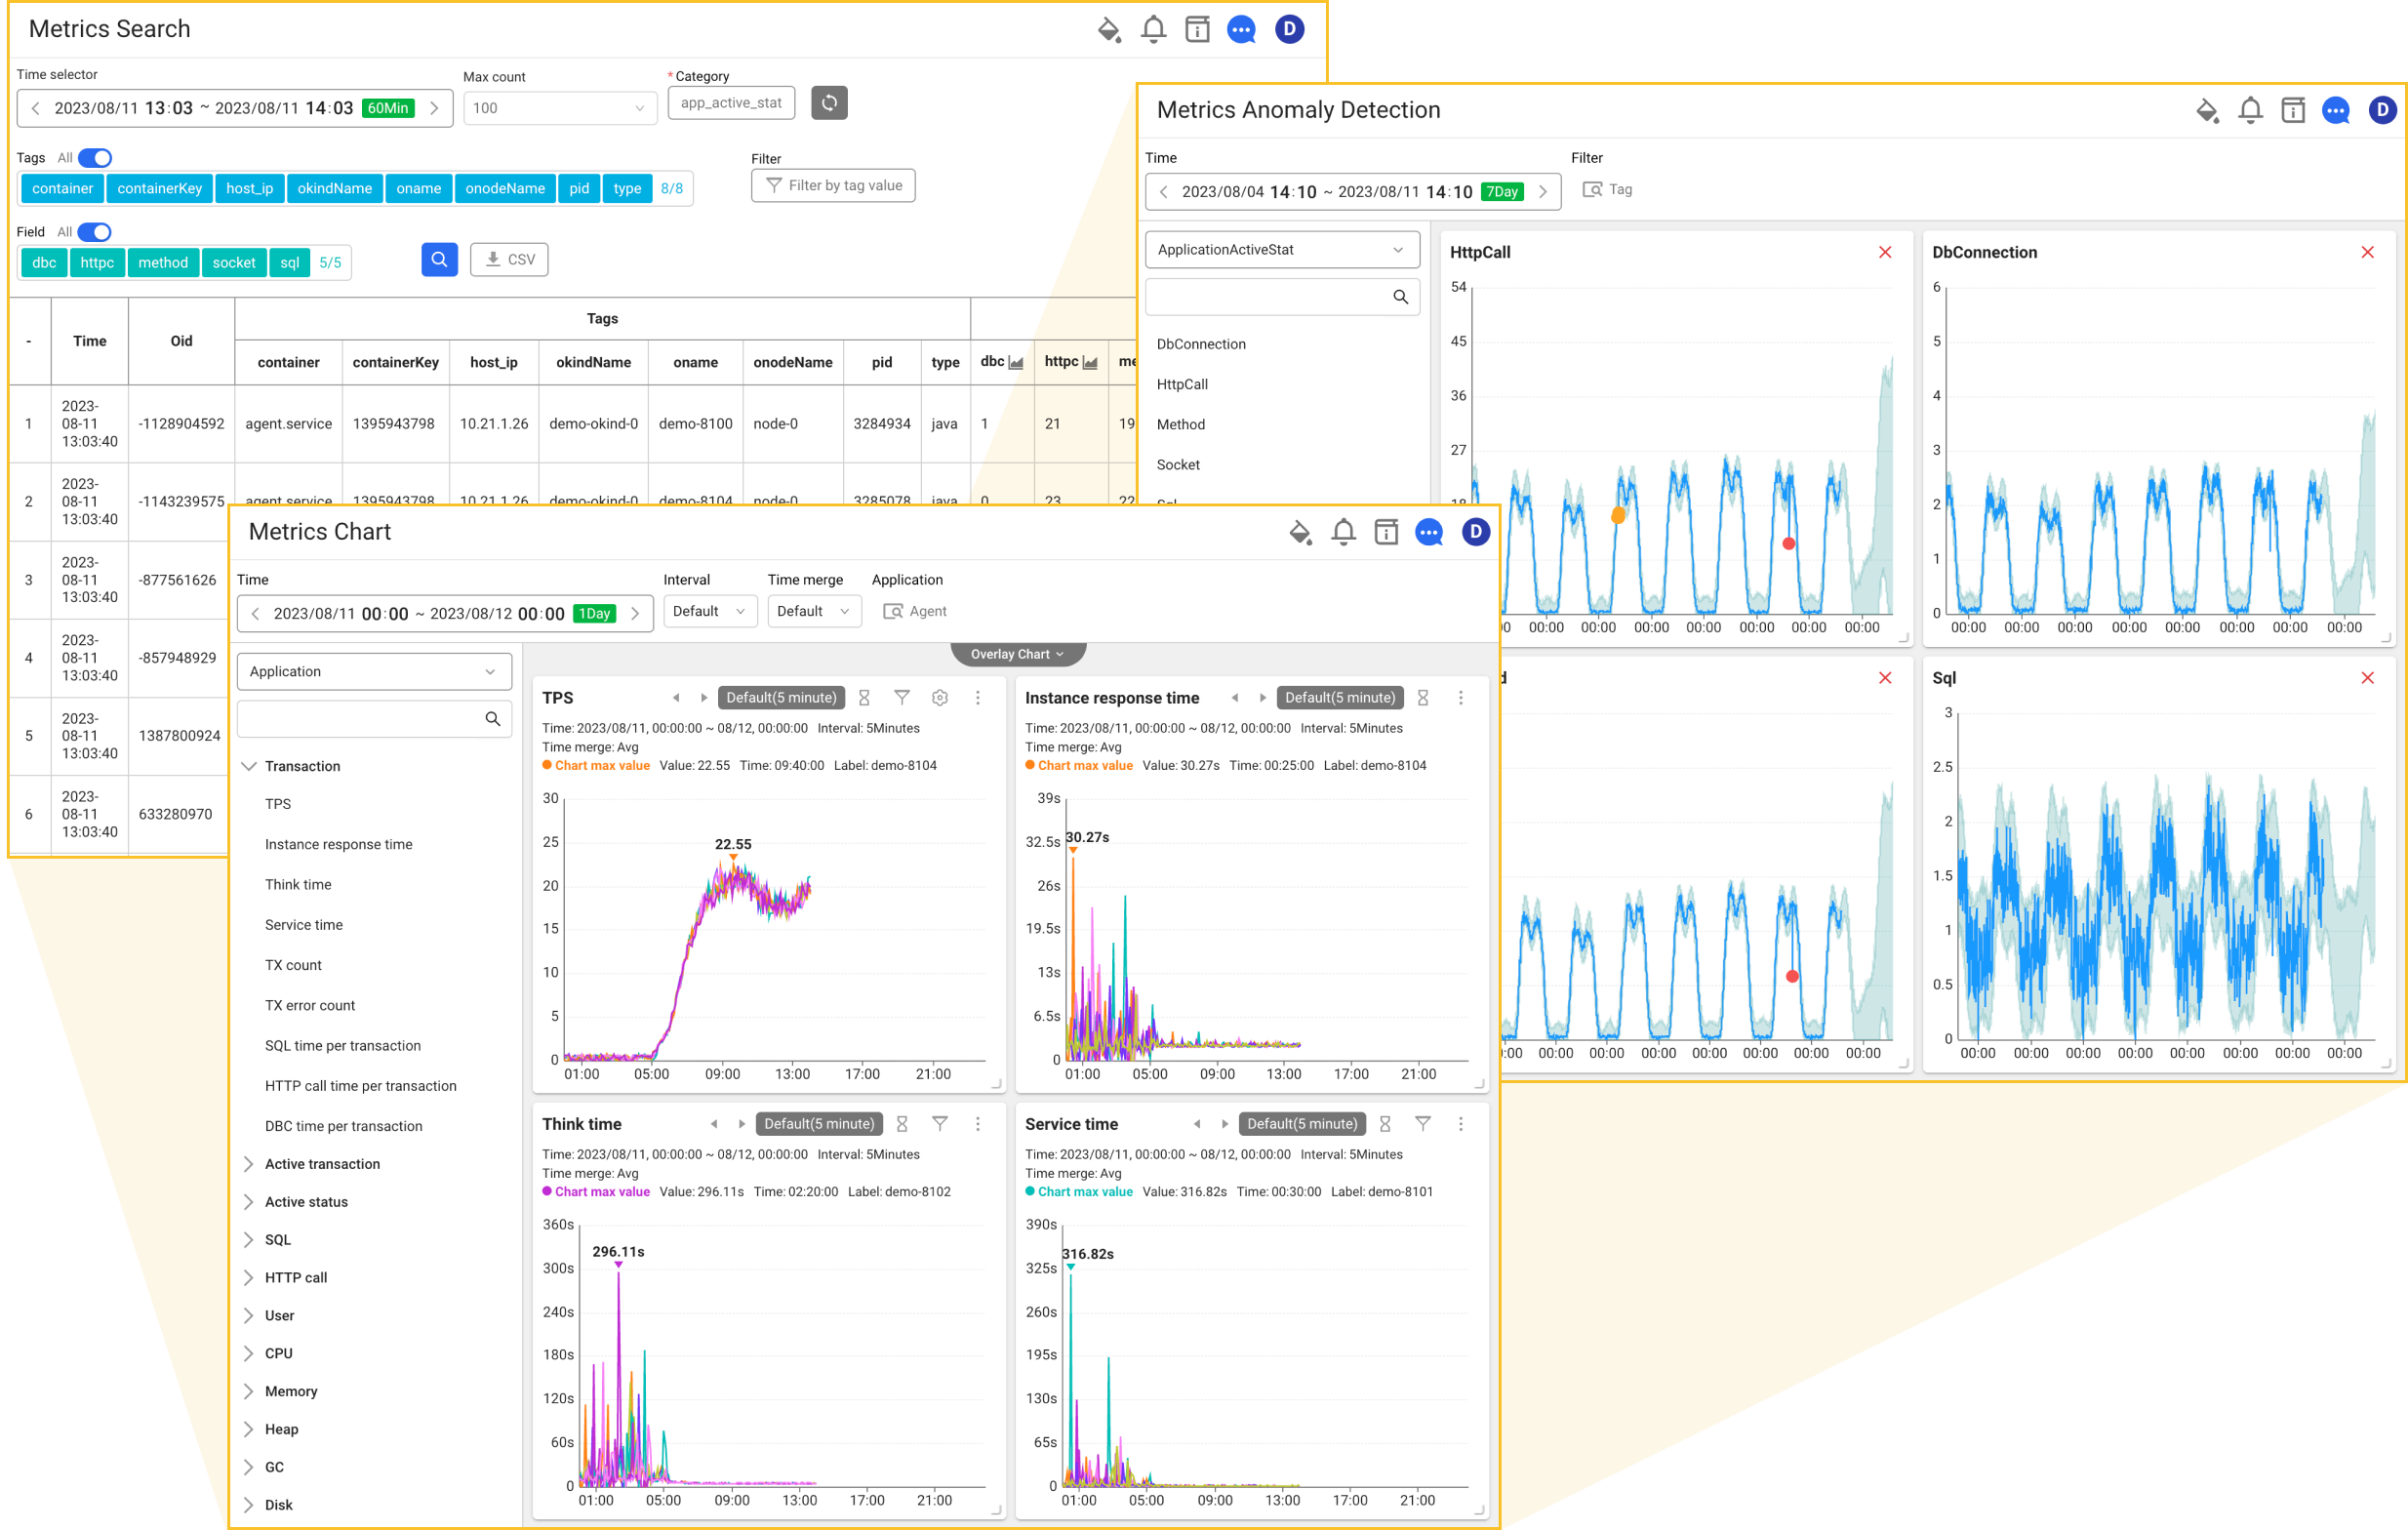
Viewing and visualizing the metrics data
WhaTap provides a list of original data collected according to the conditions specified by user and various charts visualized for convenience as follows. See the menus such as Metrics Search that can look up the original data of metrics, Metrics Chart that can look up metrics data through visualized charts, and Metrics Anomaly Detection that can detect out-of-pattern anomalies by comparing with the patterns of metrics learned by AI.