Log
Home > Select Project > Dashboard > Container Map > Target selection, Detailed analysis > Log
Kubernetes logs
The WhaTap Kubernetes monitoring service collects and stores the logs that occur in Kubernetes.
Kubernetes has two types of logs:
-
Standard out logs for each container
-
Logs output by applications running inside each container
These logs serve to compensate for monitoring blind spots that are difficult to check with the container status or metrics data. You can check these logs as follows:
-
Standard Out logs of each container can be checked through the
kubectl logscommand provided by Kubernetes without entering into the container. -
Application logs in each container must be checked in the container or for that purpose, a separate log collection method must be devised.
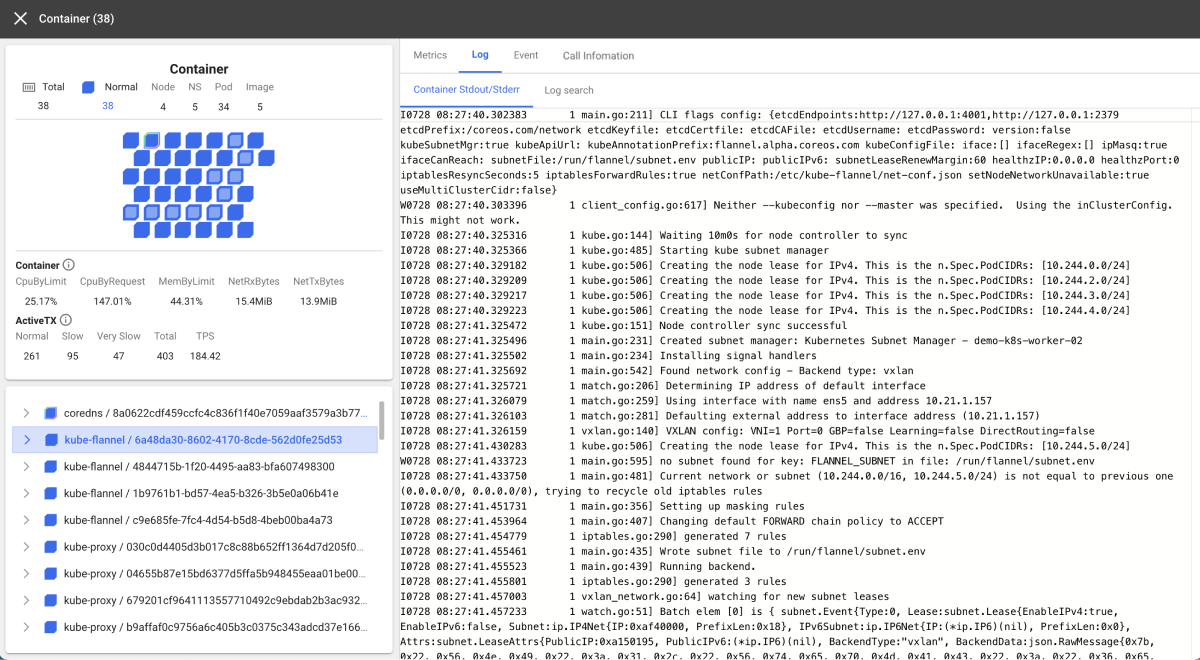
Recent log messages (Container Stdout/Stderr)
This function allows you to immediately check the current container logs. You can fetch logs directly from your cluster environment to view real-time logs for the selected containers or applications within the selected pods. To check the container logs, the following command is used.
kubectl logs pod/<Pod명> -n <Namespace명>
If there are multiple containers in a pod, select each individual container to view logs.
kubectl logs pod/<Pod명> -c <container name> -n <Namespace명>
It is very inconvenient to access the terminal screen and run the command line tools every time to check logs. By using the Log function of WhaTap Kubernetes Monitoring, you can conveniently check the current logs.
However, there are things to think about. If you exit the container, you cannot see logs any longer. Even if the container is still running, you can check only the logs for a specific period or amount. The WhaTap's Recent Log Messages (Container Stdout/Stderr) function allows you to see the logs in the Kubernetes environment. The disappeared logs from the user environment are difficult to check even through WhaTap.
Therefore, a separate method is required for stable and continuous management of log data. In particular, as the microservice architecture spreads and the number of containers for businesses increases, the log checking and management methods are becoming more complex.
Any good idea?
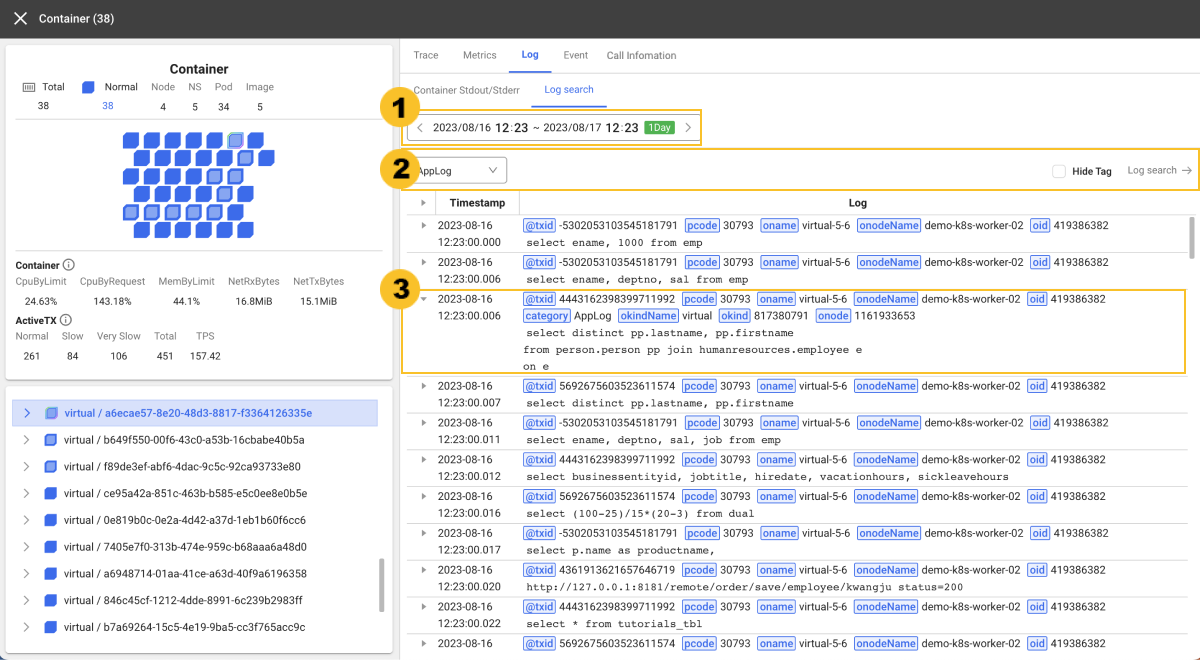
Log Search
All the related logs disappear when the container is shut down, but you can check the logs that have occurred on the selected container or pod through Log search. When storing the container Standard Out logs, you can set the storage period and check information for specific targets or perform correlation analysis.
-
Through the
 time selector, you can select a desired time for searching data.
 -
By specifying the
 category through the options on the left, you can search data. For more information about the categories to view, see the following guide to Bock and Group.
 -
If you select
Hide tag on the right, the timestamp and message can be seen excluding tags during log recording. -
Click
Log search on the right. Then Log > Log search appears where you can search in detail through the functions such as Filtering. -
If you select

 More, the parsed key values and log messages can be displayed. For more information, see the following.
General blocks and micro blocks

-
 General block
A single polygon in the container map is called a block. In the
containerStdoutcategory of the log, you can see the information whosecontaineridmatches. -
 Micro block
Blocks with agents installed are called microblocks. In addition to the
containerStdoutcategory, you can also seeApp*related categories such asAppLog,AppStdOut, andAppStdErr. If you select the category, you can see the logs that matchmicroOid(agent ID in the block).
Group
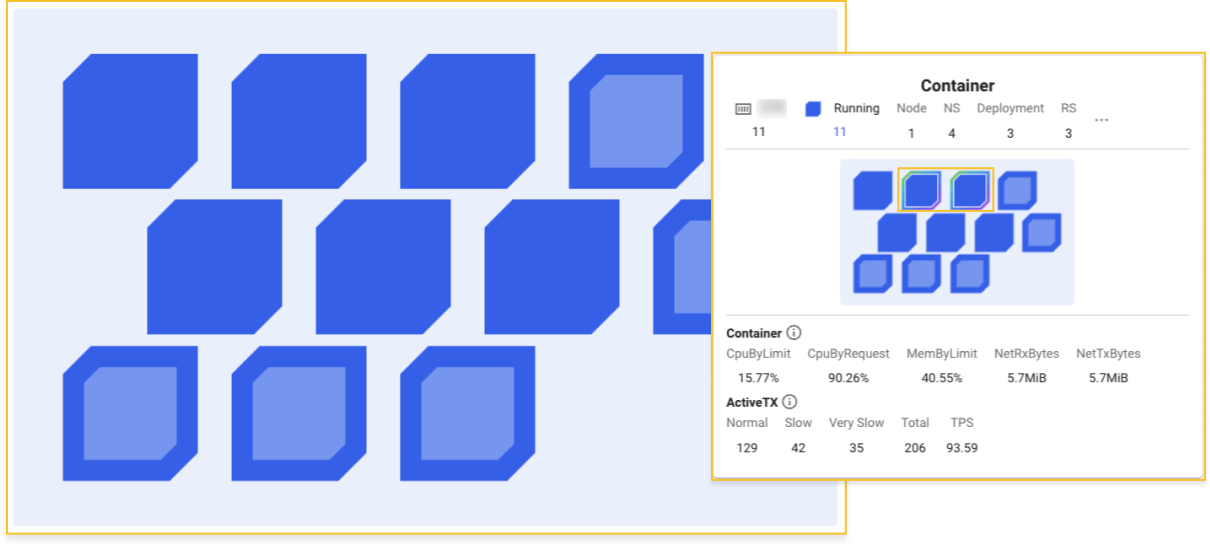
When all blocks are selected on the Container map screen or multiple blocks are selected from the card on the View Detailed screen, the multiple blocks are called a group. When selecting a group, you can see all the logs in the containerStdout and App* categories in the Log search tab.
Adding the node agent settings to save Standard Out
To save the container's standard outputs through the WhaTap log service, set the logsink_enabled=true option in the WhaTap Kubernetes node agent. For more information about the settings and the WhaTap log monitoring service, see the following.
Adding the application agent settings for collecting application logs inside containers
To collect the logs of applications running on containers through the WhaTap log service, see the following. Java, Python, and Go are supported.
If you enable the WhaTap log service and use the container's standard output log storage function, an additional fee is incurred. For more information about pricing, see the following.
Some older versions of the agent do not provide the function to save container standard output logs. The agent upgrade method is as follows:
kubectl set image daemonset/whatap-node-agent whatap-node-agent=whatap/kube_mon:<에이전트버전> -n whatap-monitoring
The latest version of the WhaTap Kubernetes agent can be checked in the following.