Out Of Memory Killed Container
Home > Project Select > Container > Out Of Memory Killed Container
Through the Out Of Memory Killed Container menu, you can quickly search for containers where Out Of Memory (OOM) occurred and check the change trend in memory usage. This change trend may be sudden or gradual. By checking this, you can objectively determine the appropriate number of PODs and the memory threshold.
Example of OOM occurrence
Out Of Memory occurs when the container's memory usage exceeds its limit, or the node on which the container is running encounters an out-of-memory condition. If the container exits with the code 137, it indicates that SIGKILL has been received by Out Of Memory.
Basic screen guide
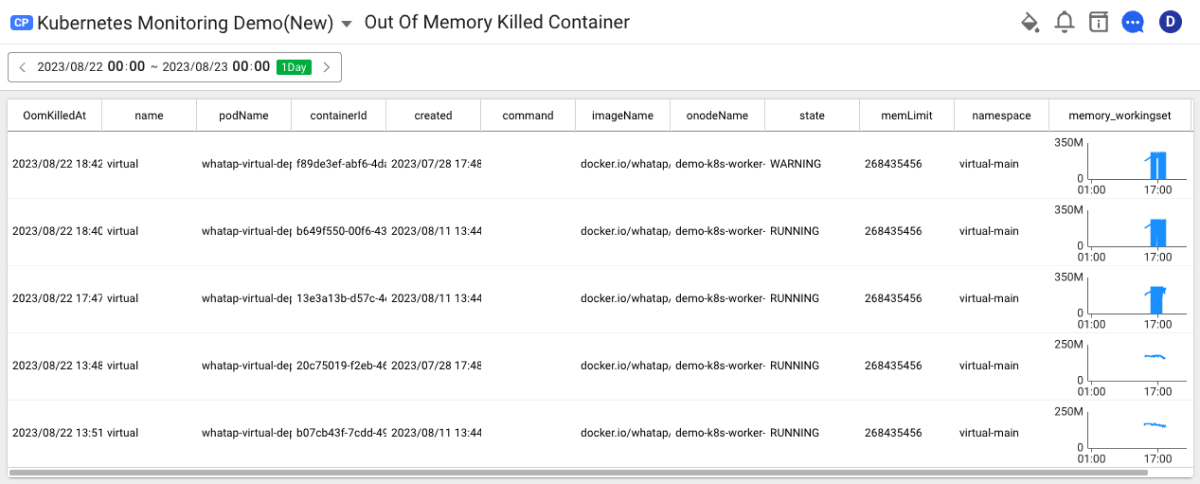
-
You can select a time zone to view by clicking the time selector at the upper left. You can search for up to 2 days.
-
You can quickly find information about a specific container to search by entering its name in the input field at the upper right.
-
You can check the memory usage trend of the selected container by clicking the Details icon on the right of the list.
-
It provides the OOM containers in the list format. For more information, see the following guide.
OOM killed container information
The columns provided in the Out Of Memory Killed Container menu are as follows:
| Columns | Meaning |
|---|---|
| OomKilledAt | Time stamp where Out Of Memory Killed occurred |
| ContainerName | Container name |
| ContainerId | Container ID |
| Pod | Name of the Pod to which the container belongs |
| ApplicationName | Name of the application running in the container. |
| Created | Time stamp generated by the container |
| Command | Container's execution command |
| Image | Container's image name |
| Namespace | Name of the namespace to which the container's Pod belongs |
| Node | Node name on which the container is running |
| MemLimit | Container's memory limit size |
| MemWs | Actual memory in use, excluding the memory disabled in the container |
-
If you click containerId, the Container list menu appears.
-
If you click Pod, the Pod list menu appears.
-
If you click _ ApplicationName_, the Container application list menu appears where the application is found.
-
If you click Node, he Node list menu appears.