Browser Monitoring
Browser Monitoring collects and analyzes various performance metrics such as page load time, server response time, resource loading time, and browser errors for browser applications. Through the collected and analyzed data, bottlenecks or performance issues for browser applications can be identified and optimized. It also provides insight into performance differences across browsers, providing you with the data to have the best user experience.
Why do you need Browser Monitoring?
-
Optimizing the response time for browser applications in a complex server environment in the era of Cloud and MSA
With the advent of Cloud and MSA, the server environment has become more complex. In this complex environment, it is difficult to determine the cause of a slow browser application response time based on the performance metrics of each individual server. Accordingly, the factors including the network status between the server and clients and the browser loading time must be taken into account. In addition, the related factors such as browser's request data size and request cycle that can affect the response time should be considered.
Browser Monitoring is required to optimize the response times and user experiences of real users.
-
Quick response to unpredictable errors that occur in real user environments
Due to the introduction of CI/CD, where development, modification, and distribution are made frequently, it is difficult to prevent errors that occur to actual users by only pre-release testing. Various errors may occur depending on the user device, browser type, and network conditions while using web pages.
Browser Monitoring should monitor errors that occur to actual users and apply technical approaches to prevent or minimize them.
-
Provision of statistical data to provide optimized user experiences in various browsers and devices
As browser types and devices become more diverse, it is required to monitor errors encountered by real users. For example, you can see the errors that occur only in a specific browser or device. This allows us to improve user experiences and provide better services.
-
Analyzing and optimizing the browser application performance in the SPA environment
In a web application, Single Page Application (SPA), web pages have been implemented primarily in the browser. In the past, all elements of a web page were rendered on the server, but now the browser renders pages and fetches only the required data from the server for operation. With all this complexity of web applications, you cannot tell the application performance status only by managing the server. Therefore, Browser Monitoring should be used to find problems in browser applications and perform optimization.
-
Improving the user experience performance through the comprehensive response time measurement and optimization of 1st party and 3rd party resources
The performance experienced by actual users of any web service should be comprehensively measured with the response times of the 1st party resources operated in house and the 3rd party resources operated externally. The overall response time may be delayed only by the response time delay of the 3rd party resources.
Key features
Browser Monitoring monitors the website operation problems, end-user usability, and end-user environment from the end user's point of view. It provides the following key features.
Provision of the page load performance data
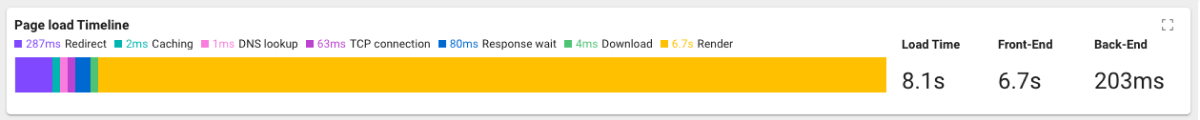
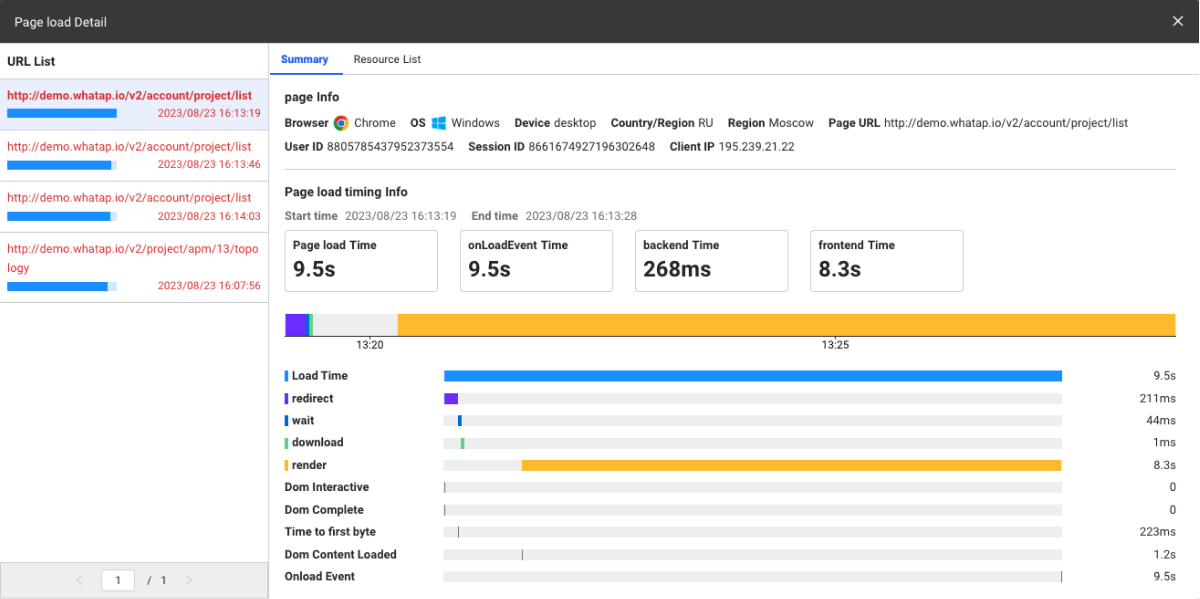
It monitors how quickly the browser loads web pages. Users prefer the web pages that are loaded quickly. Accordingly, the page load performance data allows developers to optimize the web page performance. The page load performance data provides information such as how long it took the browser to load pages, how long the page elements were loaded, and the server response time. This information can help you find the way to improve the performance of the web pages.
Provision of AJAX performance data
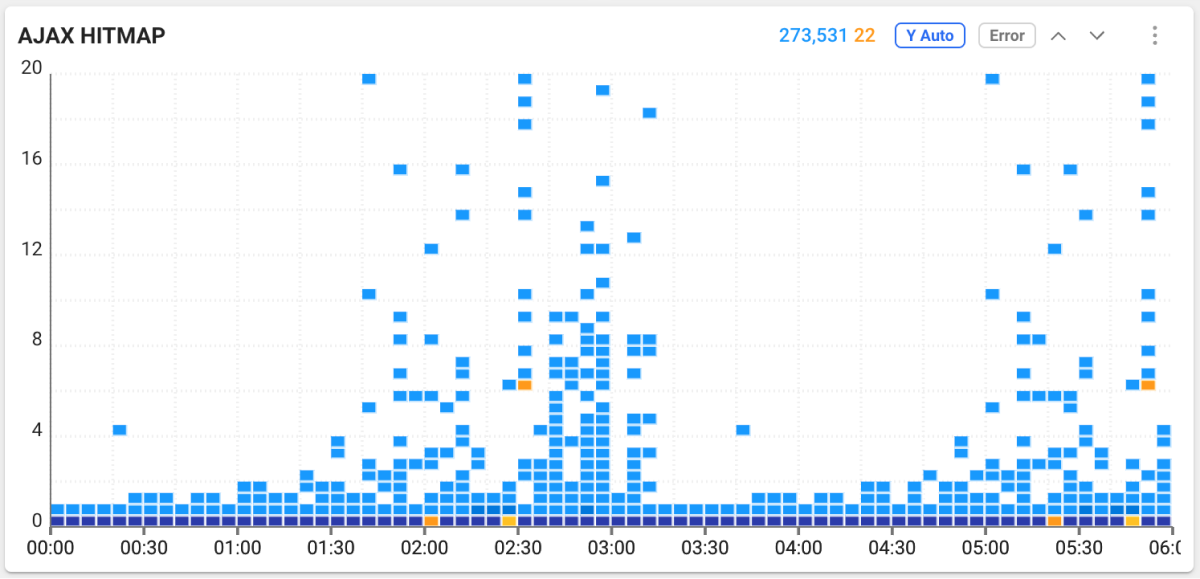
It monitors the performance data when exchanging data with the server via AJAX. AJAX is a technology that allows the web pages to exchange data asynchronously with the server, allowing browser applications to be updated without refreshing the pages. Browser Monitoring collects various data, including AJAX requests and response times, server response time analysis, and network latency. The collected data is useful to improve the performance of browser applications and improve the user experience.
Provision of the web page resource data
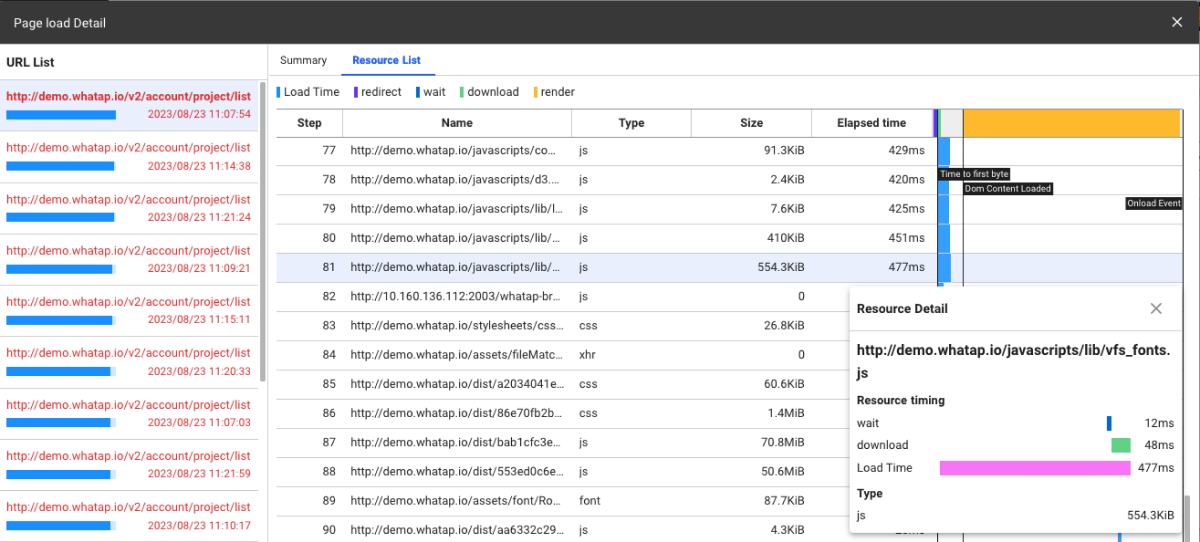
The resources downloaded from the server by the browser significantly affect the page loading performance. The resource list lets you quickly identify the resources that are slow to load or have large files. We can use this information to improve the performance of web pages and the user experience.
Provision of the browser error information
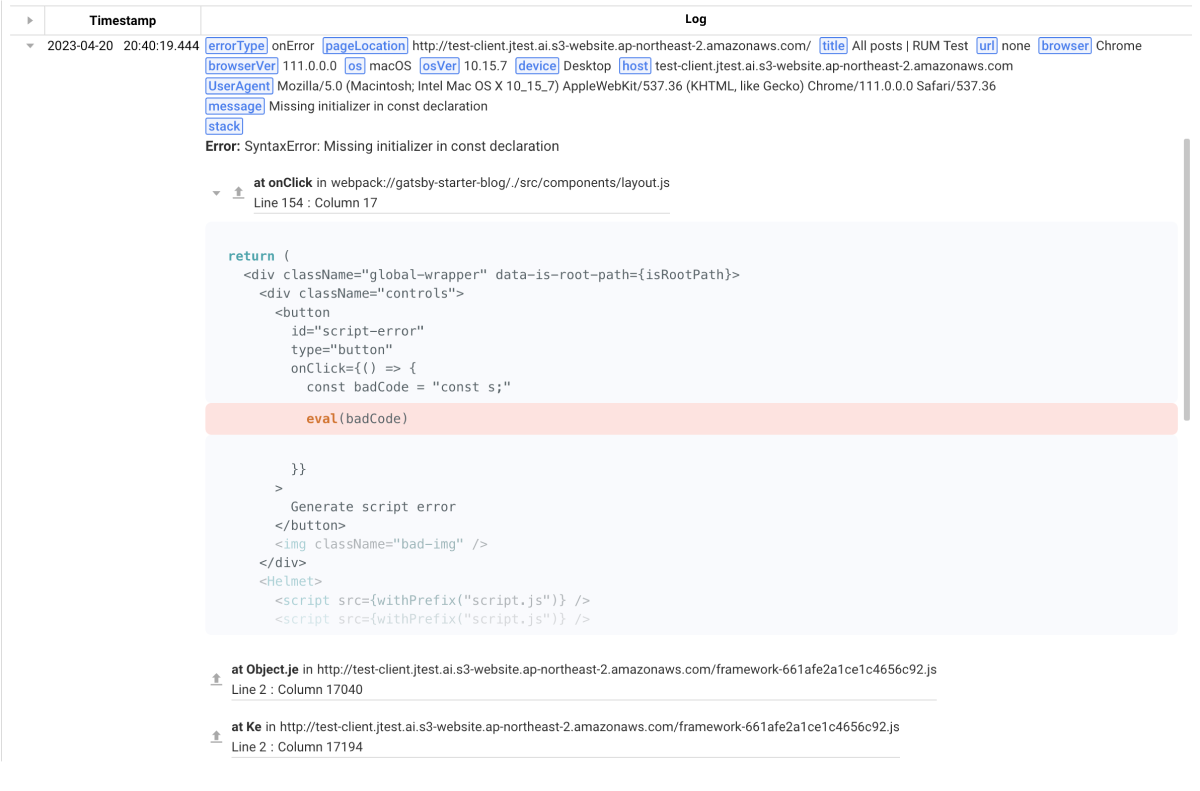
It collects browser error data that occurs while using the website. This information enables developers to identify and respond quickly to any problems while using the website. You can improve the user experience and increase the stability of the website.
Provision of the core web vitals information
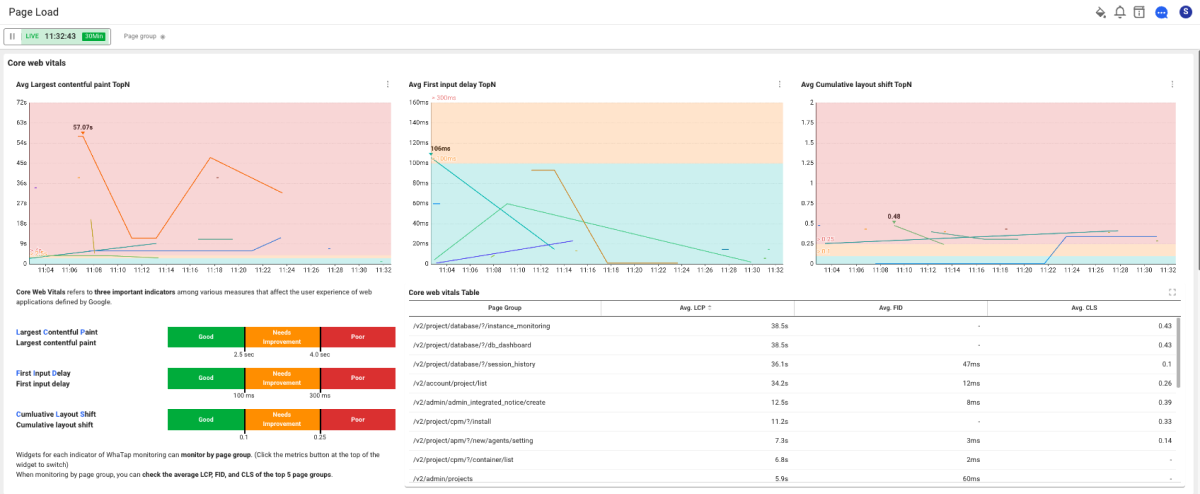
Core Web Vitals is an important metric for the web page performance, defined by Google, including page load time, response time, rendering time, and user interaction time. By collecting and analyzing this data, we can help the website achieve higher exposure.
User access environment analysis
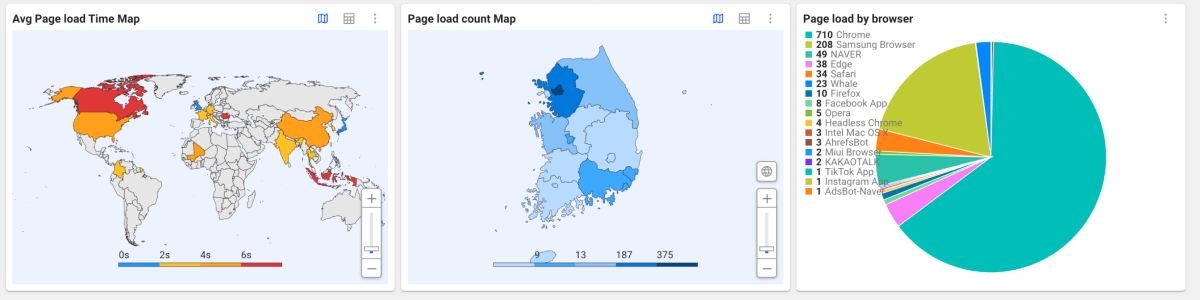
It analyzes various user access environments such as user device information, browser information, operating system information, and regional information.
If a problem occurs on a specific device, you can resolve the problem by analyzing information from the device. In addition, if the web application runs slowly in a specific region, you can optimize it by identifying information in the region. By identifying the browser or operating system, we can provide the data needed to resolve web application compatibility issues.
Starting the browser monitoring
You can start browser monitoring by following the steps below.
-
If you have no WhaTap account, proceed with Sign Up.
-
Check the browser compatibility and preliminary settings.
-
Go to WhaTap Monitoring Service and then create the browser project.
-
Apply the browser agent.