Top SQL by Wait
Home > Select Project > Statistics > Top SQL by Wait
Top SQL by Wait focuses on quickly identifying SQL tuning priorities. You can visually confirm the Wait Class and Wait Event with the most wait time during a specific time period through charts and tables, and compare execution count and average time in the Top SQL table.
Basic Screen Guide

Wait Class Chart
Clicking a class in the chart or legend will apply it as a filter. Clicking again will remove the filter.
-
The Wait Class bar chart at the top visually displays the proportion of total wait time during the selected analysis period.
-
The selected filters are shown as tags.
Wait Event List
If no class is selected, the most frequent events within the selected time range are displayed. When a Wait Class filter is applied, the event list for that class is shown.
When a Wait Event is selected from the list, it is added as a filter to the SQL List.
Wait / System Stat Trends
Visually displays the distribution of Wait Classes and session counts over time. You can identify spikes in wait events by time range. Analysis categories include: Wait(time), Wait(count), Latch, Enqueue, Stat, Cpu, Memory, Session Count.
SQL List
Key execution performance metrics are displayed for each SQL item, including Elapsed Time, CPU Time, Wait Time, Execute Count, and Logical Reads, enabling quick comparison and analysis.
-
Default (no filters selected): Displays the top 50 queries by Elapsed Time.
-
When a class is selected: Displays the top 50 queries by Wait Time for the selected class.
View Query Details
When you select the query column item in the retrieved result list, the SQL Details window appears.
Click View SQL Statistics → to move to the SQL statistics menu, where you can check the statistical information related to the SQL query.
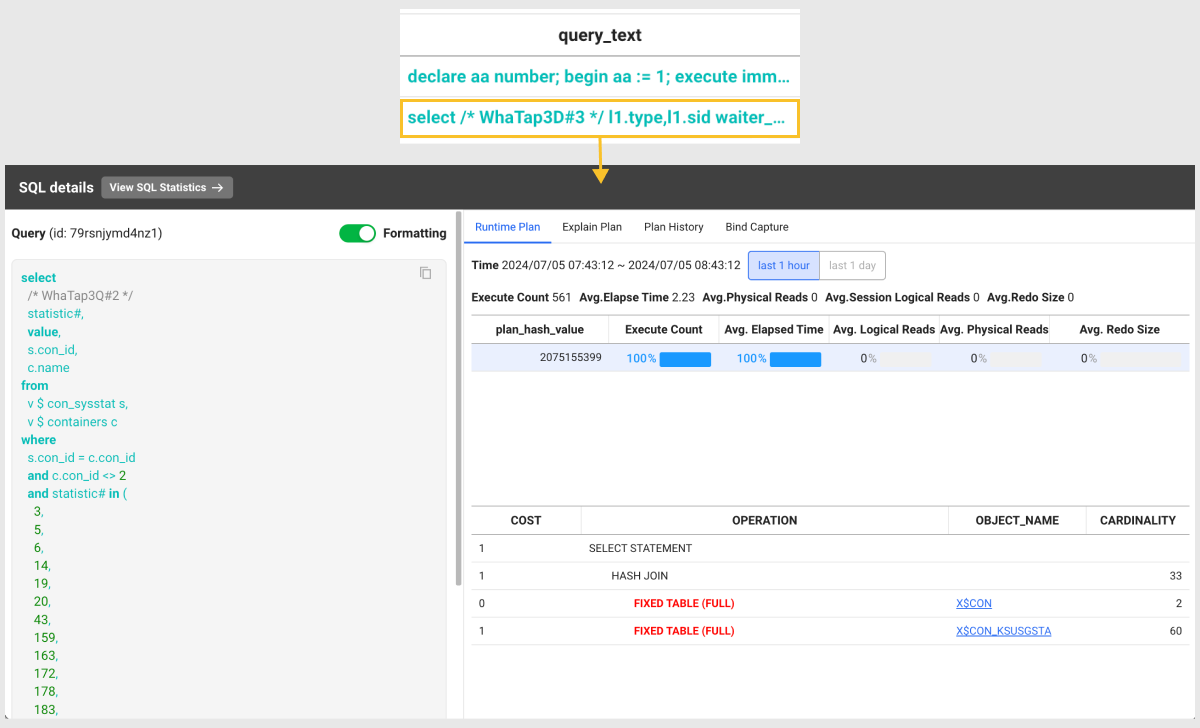
The tabs of the SQL Details window are as follows:
-
Trend: Analyze execution time, I/O, and wait events of a specific SQL comprehensively to quickly identify performance bottlenecks.
-
Runtime Plan: Provides execution plan and runtime information for the selected SQL query. Includes details such as execution count, average execution time, and average physical reads.
-
Explain Plan: Shows the execution plan predicted by the optimizer, including cost, operations, object names, and cardinality.
-
Plan History: Check the history of execution plans for SQL queries that have been run in the database.
-
Bind Capture: Shows the bind variables used in SQL queries executed in the database. Values are masked by default and must be decrypted with the parameter key. See Checking Bind Capture values.
NoteThese are not real-time bind values, but values captured in the database (
v$sql_bind_capture). If there are many, up to 100 entries are displayed.
Trend Tab
The upper chart visualizes Elapsed Time, I/O, and Wait Time trends by time range.
The lower statistics table shows accumulated execution statistics, Wait Class ratio, and major Wait Events at a glance.
Elapsed Time
Displays the sum of CPU time, Wait Class time, and Idle time during the selected period with the time selector.
Example:
- CPU Time: Time actually spent using CPU for SQL execution
- Scheduler: Time the session waited for CPU
- Idle: Time not executed, waiting, or idle (intuitively confirms which factor consumed the most time)
Elapsed Time Trend
Aggregates average Elapsed Time and execution count at 5-minute intervals and shows the trend.
If the period is less than 3 hours, it aggregates by 1-minute intervals.
This helps quickly identify whether Elapsed Time spiked at a certain time or response time increased compared to execution counts, making it useful to pinpoint performance degradation timing.
I/O Trend
Shows Logical Reads and Physical Reads during query execution in 5-minute intervals.
If the period is less than 3 hours, it displays by 1-minute intervals.
- Logical Reads: Number of reads from buffer cache
- Physical Reads: Number of reads directly from disk. Useful for comparing cache efficiency and I/O load to identify bottlenecks
Wait Time Trend
Shows Wait Event elapsed time during query execution by time range.
If Wait Time spikes at a certain moment, it indicates DB resource contention or I/O latency. You can track which events (locks, I/O, parallel processing, etc.) caused the bottleneck.
Total Statistics
Displays accumulated SQL execution statistics for the selected range.
Example:
- sorts(rows): Total number of sorted rows
- session logical reads: Session logical read count
- table scan blocks gotten: Number of blocks read during table scans
- elapsed_time: Total elapsed time
Confirms aggregated data of how SQL execution used resources.
Total Wait Classes
Shows the sum of Wait Time that occurred during SQL execution, grouped by Wait Class.
The more time consumed by a specific Wait Class, the more likely that area is the bottleneck.
Example: Idle, Scheduler, User I/O, Concurrency
Top Wait Events
Displays the top detailed Wait Events during the selected range.
Provides a more fine-grained view than Wait Classes to see which events most impacted performance.
Example: PX Deq: Execution Msg, resmgr:cpu quantum, direct path read, etc.