Wait analysis
Home > Select Project > Analysis > Wait Analysis
You can check in which wait event the active session is waiting and which wait events occur frequently. Active sessions collected every 5 seconds can be analyzed from the wait perspective.
-
This function is supported in DBX agent 1.9.0 or later.
-
The collected wait and stat information is based on the
v$system_wait_class,v$system_event, andv$sysstatviews.
For detailed descriptions of each metric, see the following.
Select the Time and Instance to view. You can see the wait data corresponding to the set time and instance. If there are active sessions that frequently wait (delay) during the query period, it can be used to analyze what types of wait events occurred.
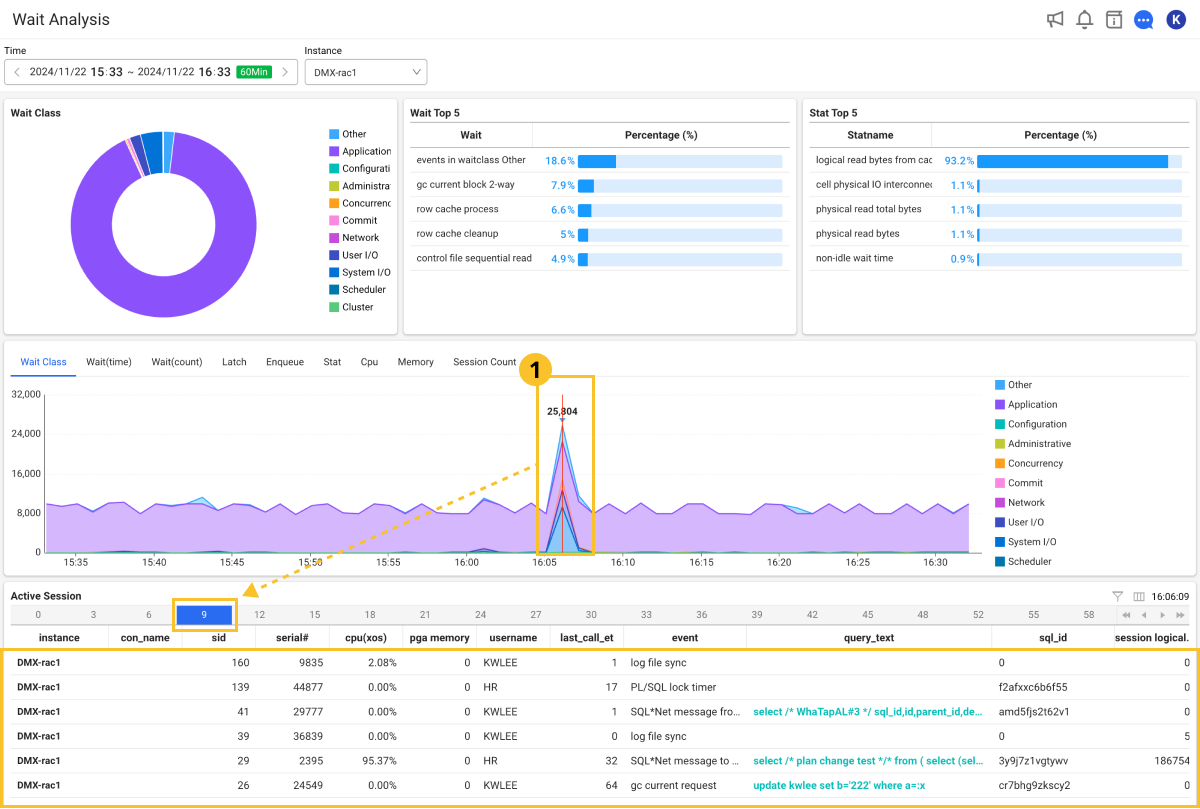
The center time-series chart visually displays the distribution of wait classes and number of sessions by time zone. This allows you to identify patterns of increased waiting events in a specific time zone. You can select analysis categories such as Wait (time), Wait (count), Latch, Enqueue, Stat, Cpu, Memory, and Session Count.
If you select the  detailed time in the time-series chart, you can view the active sessions in the time and check the SQL statements in which the wait events occurred.
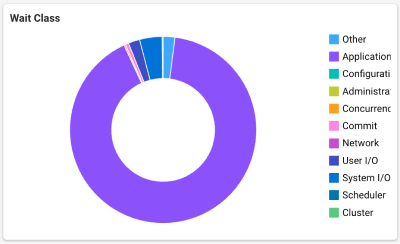
Wait Class
It visualizes wait events for each wait class with a pie chart. This allows you to quickly identify the causes of major wait events. If the wait class is abnormally high, focus on checking the resources related to the class.
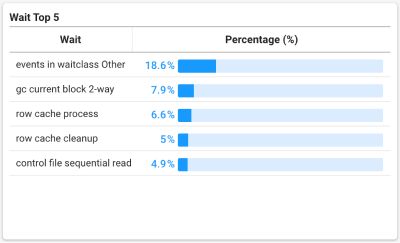
Wait Event Top 5
It displays the top 5 frequent wait events. The percentage of each wait event can help you determine which events have the greatest impact on system performance, which is useful for identifying bottlenecks in the system.
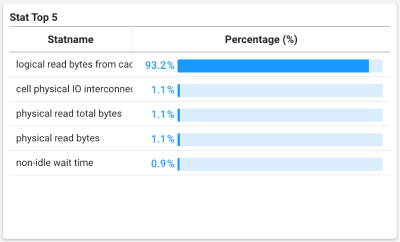
Stat Top 5
The top 5 key stat data are displayed in percentage (%). You can quickly find the resource usage status and which operation is having the greatest impact on the database.
-
The wait analysis results are used as a tool to help diagnose their causes, and problem resolution must be performed at the DBA's discretion.
-
You need to adjust the time range to accurately find the time zone when the problem occurs.
-
If you become familiar with the characteristics of the wait classes and events in advance, it can speed up the analysis.
-
When you select the instance column in the Active Session section list, the Monitoring a Database Instance menu appears. For more information about Monitoring a Database Instance, see the following.
-
In the Active Session list, if you select a session, the Session detail window appears. For more information about the Session detail window.
-
When you select the query_text column in the Active Session list, the SQL details window appears. For more information about the SQL details window.
-
You can hide the table header columns or add any of them. You can also change the column order.
-
You can filter the table data to quickly find the desired item.