Service 2.13.X
Service 2.13.4
February 12, 2025
Application
Fixed In the Multi transaction tab and Analysis > Multiple Transaction Trace menu of Trace analysis, fixed the issue where the Display Detail drawer is disabled when individual nodes are clicked in the multi-transaction chart.
Server
Changed In Management > Agent Installation, added the Linux agent installation guide.
Service 2.13.3
February 7, 2025
Server
-
FixedFixed the issue where the chart data does not appear if you hover your mouse when the equalizer chart has multiple lines. -
FixedFixed the stack chart to display chart lines as broken when there is no data.
Kubernetes
Fixed In Dashboard > Container Map, fixed the issue where the entire data in the Metrics tab of the detailed analysis window appears when selecting a group.
Service 2.13.2
February 4, 2025
Application
Fixed In Dashboard > Active Transaction, fixed the whiteout issue when the okindName value is not generated.
Service 2.13.1
January 23, 2025
Database
Common
Changed In Dashboard > Instance List, changed the following when there are no agents to monitor.
-
Fixed the table list to display the message that the agent is not installed.
-
Changed not to go to the Management > Agent Installation menu.
Oracle Pro
Fixed Fixed the issue where the active session information is not viewed when the SQL details window is entered through the SQL Elapse Map widget of the Dashboard > Monitoring Multiple Instances menu.
IBM DB2
Fixed In the list of the Stat/Report > SQL Statistics menu, fixed the issue where the last two digits of the sqlHash value are truncated when the value is negative.
Service 2.13.0
January 22, 2025
Release of new features
It provides a guide to the new features released in Service 2.13.0.
Database
New Launched the IBM DB2 monitoring product.
For more information about the IBM DB2 monitoring product, see the following.
Server
-
NewAdded the Metrics Explorer menu that can analyze the past data more intuitively.-
Added categories in the Server Inventory menu.
-
Added the modal to guide the Metrics Explorer feature.
NoteThis feature can be seen in the Laboratory > Metrics Explorer path. See Next document for more information.
-
Kubernetes
-
NewAdded the kube-scheduler Dashboard menu to view monitoring data for kube-scheduler, one of the system components of Kubernetes.Note-
This feature can be seen in the Cluster > kube-scheduler Dashboard path. It is supported in Kubernetes agent 1.8.1 or later.
-
For more information about the kube-scheduler Dashboard menu, see the following.
-
-
NewAdded the Container Timeline menu that can display the container status over time.NoteThis feature can be seen in the Container > Container Timeline path. For more information, see the following.
-
NewAdded the Pod Timeline menu that can display the Pod status over time.NoteThis feature can be seen in the Workload > Pod Timeline path. For more information, see the following.
-
NewAdded a new Persistent Volume-related menu under Cluster.-
Cluster > Persistent Volume List
-
Cluster > Persistent Volume Claim List
Note-
This feature is supported in Kubernetes agent 1.8.1 or later.
-
For more information about the Persistent Volume List and Persistent Volume Claim List menus, see the following.
-
Common
-
FeatureIn Analysis > Metrics ChartNew, improved the menu features.-
Added a specific time when the Max value of the hint data is recorded upon mouse over in the chart data.
-
Added the Select/Unselect button to the entire legend list.
-
Added the feature to select colors for chart lines.
-
Added the Copy CSV button to the More menu.
-
Added the Copy chart image button to the More menu.
NoteFor more information about Metrics Chart
New, see the following. -
-
FeatureIn Alert > Notifications, added the feature to select the notification level via a third-party plugin. -
FeatureAdded the Alert > Event History menu and changed and added the real-time notification link.NoteAs in the applied Server and Database products, the links to the notification-related menus for Application, Kubernetes, Browser, and URL products.
-
ChangedReplaced the time selector feature in the Integrated Report menu.-
Daily report: You can select the start/end date and time.
-
Weekly report: Simply select a start date. Then the end date is selected automatically after calculation.
-
Monthly report: Simply select a start date. Then the end date is selected automatically after calculation.
-
If the start date is the 1st date, up to the end of the month is automatically selected.
-
If the start date is not the 1st date, up to the previous date of the next month is automatically selected.
-
NoteExample
-
If the start date is January 1, from January 1 00:00:00 to January 31 23:59:59 is automatically selected.
-
If the start date is January 10, from January 10 00:00:00 to February 9 23:59:59 is automatically selected.
-
-
FixedFixed the issue where the View resolved events switch UI does not appear when there is no data in the notification list widget of the Integrated Flex Board or Flex Board menu. -
FixedIn Usage > Balance, fixed the issue where the list does not appear. -
FixedModified the order of product icons in the search results for the project list.
Application
-
FeatureIn Dashboard > Transaction Map, added the feature to adjust the maximum value of the Y-axis on the chart by directly entering it. -
ChangedIn Dashboard > Transaction Map, when adjusting the maximum Y-axis value with the or
or  button, improved the feature so that adjustments can be made only in 10-second intervals if the value exceeds 30 seconds.
-
The segment from 10 to 50 seconds is moved at 10 second intervals.
-
The segment from 50 to 300 seconds is moved at 50 second intervals.
-
For the segment of 300 or more seconds, it is moved at 100 second intervals.
NoteFor more information about the Transaction Map menu, see the following.
-
-
FeatureIn Statistics > Transaction, added the Avg HTTP call time, Avg SQL time, and Avg SQL fetch time columns calculated based on the number of transactions.NoteFor the changed items, see the following.
Changing the column name
-
Avg HTTP call time → Average time per HTTP call: Total HTTP call time / Total number of HTTP calls in transactions
-
Avg SQL time → Average time per SQL: Total SQL time / Total number of SQLs in transactions
-
Avg SQL fetch time → Average time per SQL patch: Total SQL patch time / Total number of SQL patches in transactions
Newly added average value columns
-
Avg HTTP call time: Total HTTP call time / Number of transactions
-
Avg SQL time: Total SQL time / Number of transactions
-
Avg SQL fetch time: Total SQL patch time / Number of transactions
-
-
FeatureAdded the table columns in submenus under Statistics and improved to display the columns also in the downloaded CSV file if columns are added through the Column Settings feature.See the following for the columns added by each submenu.
-
Domain: Time sum (ms)
-
Error: Agent, Agent node, Agent kind, Initial creation time
-
Remote HTTP Call: Std dev (ms)
-
Login: Time sum (ms)
-
Referrer: Time sum (ms)
NoteInitial creation time: It is the statistical time (5 minutes or 1 hour) when the transaction error was first generated during the query period.
-
-
ChangedAdded a guide message in the initial screen of Sitemap > Netstat Topology. -
FixedIn Integrated Flex Board, fixed the error that occurs when the Active Transaction TopN widget is clicked. -
FixedFixed the issue where when checking SQL steps in the Table view tab of the Trace analysis window, if one of the substitution variables or bind variables in the SQL statement is released, all of them are released. -
FixedIn Analysis > Stack, fixed the issue where some checkboxes are partially cropped. -
FixedFixed the error that occurs in the time selector when entering the Analysis > Transaction Search menu with an organization selected.
Server
-
FeatureIn Server List > Server Inventory, added a default column to display the server activities. -
ChangedChanged the content of the introduction page to the Server monitoring product. -
ChangedImproved the server name column to be fixed when horizontally scrolling the Server Inventory table in the group summary panel and detailed view of the Dashboard > Server Inventory Map menu. -
ChangedIn Server List > Server Inventory, displayed icons for each OS in the OS type column. -
FixedIn Column settings of the Server List > Server Inventory menu, fixed the issue where the Server name column can be unchecked; changed it to a default column.NoteThe default column can be added or deleted in Column settings but its order cannot be changed.
-
DeprecatedIn Server List > Server Inventory, removed the Delete feature.NoteThe server can be removed by connecting with the Server List menu.
Kubernetes
-
FeatureIn the Target information tab of the Dashboard > Container Map menu, added the feature to check the Pod Startup Analysis information also. -
FeatureIn the Target information tab of the Dashboard > Container Map menu, added the feature to check the volume information. -
FeatureIn Container > Out Of Memory Killed Container, provided the links to the related menus.-
podName: Workload > Pod List
-
containerId: Container > Container List
-
onodeName: Cluster > Node List
-
-
FeatureAdded guidance about No data when the widget of the Cluster > kube-apiserver Dashboard menu is for the managed Kubernetes. -
FeatureIn Management > Agent Installation, added guidance to the activation of the kube-scheduler feature. -
ChangedSeparated the summary analysis feature into a tab in the following menus:- Dashboard > Container Map
- Dashboard > Node Map
-
FixedIn Dashboard > Container Map, fixed the issue where the metric name of the filter. -
FixedIn Container > Container Images, fixed the issue where tags are not displayed properly when the image name containes\@. -
FixedIn Cluster > Ingress List, fixed the issue where several incorrectly set rules are missing. -
FixedFixed the errors for Request and Limit setting messages in the container summary analysis. -
DeprecatedRemoved the feature to navigate to the tab when clicking the diagram in the following menu paths:-
Cluster > Node Timeline
-
Cluster > Node List >
 Detail
-
Database
Common
-
FeatureIn Dashboard > Monitoring Multiple Instances, added the feature to save the options of the Session Table widget in the preset.The options saved in the preset are as follows:
-
Table column selected using the Show columns feature
-
Widths of individual columns set by the user
-
Filter applied to the table
-
-
FeatureIn Management > Cloud Settings, added the AWS region selection option.NoteApplied platforms: PostgreSQL, Oracle, MySQL, SQL Server
-
ChangedIn Dashboard > Instance List, changed to display the metric name in the table header. -
ChangedIn Dashboard > Monitoring a Database Instance, changed to enable scrolling when the chart height gets smaller. -
ChangedIn Dashboard > Monitoring a Database Instance, changed to hide the tags when there are too many database tags. -
ChangedIn Management > Agent Update, added a guide message for environments using the Windows system. -
FixedIn Dashboard > Monitoring a Database Instance, changed the color of the guide text of the Session kill window in dark mode. -
FixedIn Analysis > Counts Trend Comparison, fixed the issue where the data in the Session detail window that appears when a row in the Active sessions table is clicked, does not appear. -
FixedFixed the issue where the agent list does not appear when you go to the Management > Agent List menu for the first time. -
DeprecatedIn Management > Agent Installation, removed the XOS agent execution role assignment command.
Oracle
Changed Changed the design of the agent installation screen.
Oracle Pro
-
FeatureAdded the tuning guide feature to the plan tree in the Session detail and SQL details windows.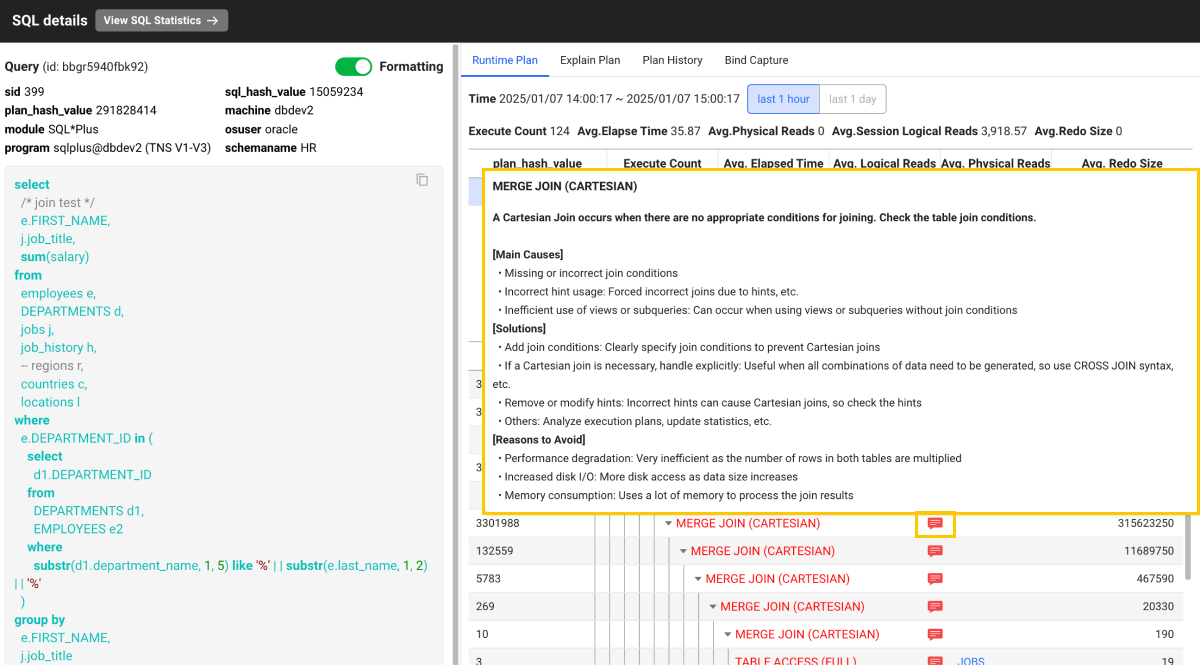 Note
NoteThe tuning guide can be viewed when the nodes in the Plan Tree are
TABLE ACCESS (FULL)andINDEX (SKIP SCAN)and the nodes contain the keyword,CARTESIAN. See Next document for more information. -
FeatureChanged the display design for statistics in the SQL details window. -
ChangedChanged the design of the plan tree structure in the Session detail and SQL details windows. -
FixedModified to select the first data when changing to the last 1 hour or last 1 day in the SQL details window. -
FixedIn Analysis > SQL Analysis, fixed the issue where a filter is added when clicking the Apply button with no conditions when first creating the filter conditions. -
FixedIn Analysis > SQL Analysis, fixed the issue where multiple conditions with the same key are created and processed asORcondition even if they are inANDcondition.
MySQL
Fixed In Analysis > Dead Lock, fixed the issue where data cannot be loaded.
SQL Server
-
FeatureImproved the features and UI design of the Stat/Report > Procedure statistics menu.-
Added colors for table rows when the definition column is selected.
-
Added the plan_handle column in the query statistics table.
-
Applied formatting for numeric data.
-
Displayed the unit (μs) for time data.
-
-
ChangedIn Stat/Report > Procedure statistics, changed to display identical queries as one. -
FixedIn Stat/Report > Procedure statistics, modified the setting of the Filter option to apply only to the Procedure Statistics table. -
FixedModified the SSL authentication-related options on the agent installation screen.
Browser
Feature In Statistics > Resource Load Statistics, added the feature to check the statistics details.
For more information about the Resource Load Statistics menu, see the following.
Log
-
FeatureIn Log > Log Configuration, added the de-identification feature for personal information.-
You can set the category and field by entering them through the De-identification of personal information tab.
-
Added the Personal information query in log role.
-
Added the button to show or hide personal information in the following menu paths depending on the Personal information query in log permission.
- Log > Live Tail
- Log > Log Trend
- Log > Log Search
- Trace analysis > Transaction log
-
-
FeatureIn Log > Live Tail, improved to fill in 200 data items if the data count is less than 200 when requesting data for the first time. -
FeatureIn Log > Log Configuration, added the de-identification checking feature for personal information. -
ChangedIn the following menu path, removed the Search, Exclusion search item from the drop-down menu that appears by clicking the tags of the log containing the search keys that are not indexed (.p,.pii, etc.).- Log > Live Tail
- Log > Log Search