Resource Load Statistics
Home > Select Project > Statistics > Resource Load Statistics
Resource Load Statistics provides the criteria needed to improve web page performance. It visualizes performance data for each resource on the web page to show performance trends, response times, and sizes at a glance. This allows you to understand the impact of each resource on page load and analyze performance bottlenecks. You can identify resources with long load times, optimize large-scale resources, and check the performance impact of 3rd party resources.
For more information about the collected data, see the following.
Checking the resource load statistics
It provides data needed to reduce the page load time and improve user experience. By clearly identifying the cause of performance degradation, improvement efforts can be carried out more effectively.
-
Go to Statistics > Resource Load Statistics menu.
-
In Time, set the date and time to query the performance metrics.
-
Configurable time range: Minimum 5 minutes, maximum 3 days
-
Data query unit: 2 hours or less → 5-minute intervals, more than 2 hours → 1-hour intervals
-
-
In Statistical criteria, select the desired option. For more information, see the Statistical criteria document.
-
Click the
 button on the upper right of the screen.
 -
The performance metrics for the selected time range are displayed as charts and lists in each section.
- If you hover the mouse over the graph, you can check the detailed metrics for that time zone.
Selecting the statistical criteria
Statistical criteria is an option that allows users to check the statistical metrics to analyze based on the selected criteria.
| Statistical criteria | Description | |
|---|---|---|
| Avg | Provides statistics by calculating the average load time for each resource. It is useful for understanding the overall performance. | |
| Max | Provides statistics based on the maximum load time for each resource. You can identify which resource has the most inefficient page load time. It can be used for analyzing sections with longer response times or larger sizes. | |
| Min | Provides statistics based on the minimum load time for each resource. You can identify which resource has the fastest page load time. | |
Load count trends by resource type
Visualizes the load count by resource type on an hourly basis. If the load ratio of a specific resource type is excessively high, it may cause a performance bottleneck. In that case, analyze the cause of the resource and proceed with optimization.
-
The pie chart displays the ratio by resource type. If you hover the mouse over the chart, you can check the ratio of the resource as a tooltip.
-
The bar graph displays the trend for the number of resource loads per time unit. If you hover the mouse over the graph, you can check the load count by resource type for that time zone as a tooltip. When the user selects a specific time in the bar graph, the data in the Resource Load Count Top 10 - Elapsed time, Size and Resource group list sections is updated for the selected time range.
For more information about the resource types, see the following.
Resource load count - Elapsed time
Provides the response times of the top 10 resources with the highest load count as a chart and list. You can quickly identify resources causing performance degradation. You can also check the response time trend over time to analyze delays occurring in specific time zones. It can be used to identify resources with long response times and optimize server response time and network delays.
Resource load count - Count
Provides the sizes of the top 10 resources with the highest load count as a chart and list. You can identify large-scale resources causing poor web page loading performance. You can improve page performance through image optimization, JS bundling, and compression.
Resource group list
Provides a list of all resources loaded on the web page. You can check detailed performance metrics for each resource. You can analyze the load path and request count for a resource to reduce unnecessary repeated requests. You can check the performance status of third-party APIs or CDNs by checking the Resource host column of external resources (3rd party). For more information, see the following.
-
Click the header column in the table to sort the list based on the column.
-
Hover the mouse over the header column to see a tooltip explaining the column.
Icon item | Description |
|---|---|
 | Click the CSV button to save the query results as a CSV file. |
 Column Settings Column Settings | You can hide, add, or change the order of columns. For more information, see the column settings document. |
 | Click the new window icon to view the resource group list in a new window. |
Resource load statistics details
Click the  Detail icon in the Resource group list list on the Resource Load Statistics screen to navigate to the Resource load statistics details window, which shows statistics for the selected resource group.
-
Resource load timeline
Provides the overall load performance for the selected resource group. It displays the total resource load time and the average time for each load step, allowing you to understand the loading performance of the browser application at a glance. For more information, see the following.
-
Resource page load time trend
Checks the page load time by period for the selected resource group. You can select various performance metrics from the metric selection box. For more information about performance metrics, see the following.
-
Resource page load size trend
Checks the total size of page resources loaded for each time zone of the selected resource group. You can analyze the network load and page optimization status through the page load size trend.
-
Resource page load count trend
Checks the number of resources loaded for each time zone of the selected resource group. If the number of resources suddenly increases or increases abnormally, you can check whether excessive resource requests were made from a specific page.
-
DNS time / Server connection time / FirstByte time / Download time
Checks the average time taken for DNS query, server connection setup, first byte reception, and resource download for each time zone.
-
Resource group list
This is a list where you can check various performance metrics for individual resources included in the selected resource group.
Filtering the queried results
You can filter the retrieved statistical data by domain, performance metrics (byte, ms), or resource path to focus on analyzing the desired items.
-
Click the filter input field at the top of the screen.
-
Specify the filter in the Add filter window. Filter tags are entered in the order of
filter key,condition, andsearch value.- Using the Domain classification option, you can distinguish which entity is providing the resource. For more information, see Domain filter.
Domain filter
Using the Domain classification option, you can distinguish which entity is providing the resource and determine whether the factor affecting the performance is internal (1st Party) or external (3rd Party). This allows you to effectively analyze where bottlenecks occur when optimizing the web page performance.
-
1st Party: You can filter only the resources provided by the company. It includes web servers and self-hosted resources.
TipCheck 1st Party resources to identify performance bottlenecks on internal servers.
-
3rd Party: Resources provided by external services. It includes all resources loaded from external domains such as CDN resources, external APIs (e.g. Google Analytics), and third-party libraries.
TipAnalyze the response times of 3rd Party resources to evaluate the impact of external services or CDNs on web page performance.
Entering the filter key, condition, and search value
-
When entering the
filter key, options for resource path, resource type, and performance metrics (byte, ms) are provided. -
When entering the
condition, if thefilter keyis resource path or resource type,matchandnot matchoptions are provided; if it is a performance metric,>,<,<=,>=,==options are provided. -
When entering the
search value, matching searches (>,<,<=,>=,==) are highlighted in blue, and exclusion searches (not match) are highlighted in red.
For more information about the performance metrics that can be selected, see the following.
Removing filter tags
-
Click the X icon on a tag to delete the applied tag.
-
Click the clear all
 icon in the input field to delete all tags.
Resource types
The following guides the resource types defined in WhaTap Browser Monitoring.
| Resource type | Description |
|---|---|
| script | JavaScript file resource. For example, .js files are script files required for running front-end code and dynamic features. |
| image | Image file resource. For example, it includes various image formats such as .png, .jpg, .svg, etc. |
| fetch | An HTTP request to retrieve data from the browser. It is mainly used for API calls or JSON data requests. |
| css | Stylesheet file resource. It is the CSS file that defines the layout and design for web pages. |
| font | Web font resource. For example, it includes font files such as .woff, .ttf, .otf, etc. |
| xhr | Resource retrieved through XML HTTP Request. It is mainly used for asynchronous data requests (e.g. AJAX calls). |
| media | Media file resource such as audio and video. For example, it includes various media formats such as .mp4, .mp3, .wav, etc. |
| beacon | A request to send asynchronous data to the server using navigator.sendBeacon(). |
| document | The HTML document itself, which is a major content resource that makes up the page. |
| other | Resource classified as Other. It includes resources that are not clearly classified by type. |
Setting columns
You can hide table header columns or add desired items in Resource group list. You can also change the column order. Click the  Column Settings button.
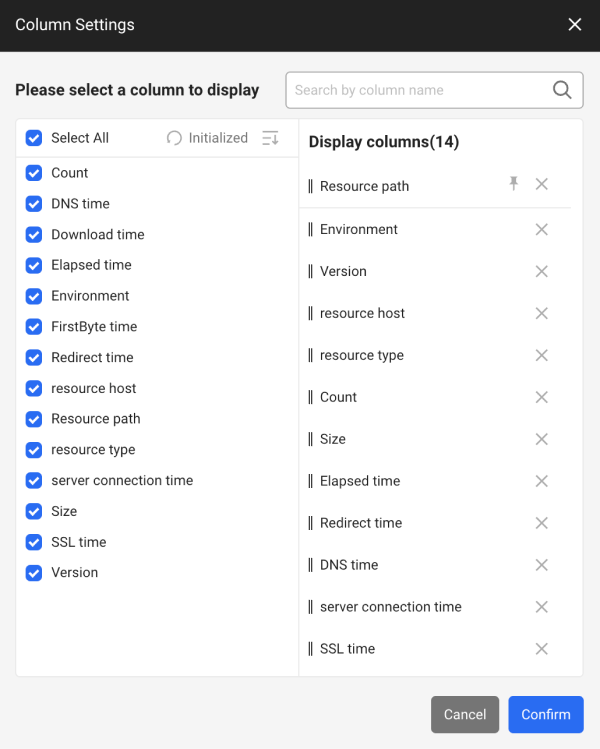
You can sort the list on the left by clicking the  (ascending) /
  (descending) icon.
Adding columns
-
In the Column setting window, select the column items to add from the list on the left.
- To select all columns, click Select all at the top of the list on the left.
-
Check that the selected column items have been added to the Displayed items on the right.
-
Once you have added all the desired column items, click the Confirm button.
For more information about column entries, see the following.
Deleting columns
-
In the Column setting window, click the
 on the right of the column item to delete from the Displayed items.
 -
Check that the checkboxes for the deleted column items are unchecked in the list on the left.
-
Once you have deleted all the desired column items, click the Confirm button.
Changing the column order
You can change the order of columns.
-
In the Column setting window, drag items to reorder from the Displayed items list and move them to the desired position.
-
After all settings are finished, click the Confirm button.
Initializing the column settings
You can cancel all changes and reset them.
-
In the Column setting window, click the
 Initialized button.
 -
To reflect the initialized settings, click the Confirm button.
Interpreting the queried results with AI Analysis
Click the AI Analysis button on the option bar to have WhaTap AI read the per-resource counts, sizes, and load time summary currently on screen and report what it finds. Use it to narrow down how large resources or third-party resources affect page load. The button shows an icon only; hover over it to see its name in a tooltip.
-
Set the query conditions and click the
button to query the data. -
Click the AI Analysis button on the option bar.
-
The AI Analysis drawer opens on the right of the screen and the result is displayed as a stream.
-
Resource statistics treat resource size as an axis alongside latency, so the result is also presented by resource type and by whether the resource is third-party.
-
If the time input is invalid, the button is disabled. Hover over it to see the reason,
An invalid time is selected.
For how AI Analysis behaves in common and the data scope it uses, refer to the following document.
Columns and terms
| Column | Unit | Description |
|---|---|---|
| Count | Count | Total number of resource requests. |
| Elapsed time | millisecond | Time taken to fully load the resource. |
| Download time | millisecond | Time taken to download resources from the server. (Time from responseStart to responseEnd) |
| Redirect time | millisecond | Time taken for redirect while loading resources. (Time from redirectStart to redirectEnd) |
| Resource type | Text | Type of the requested resource. For more information, see the following. |
| Resource host | Text | Host name of the server providing the resource. |
| Resource path | Text | URL path or file path of the requested resource. |
| Version | Text | Version information of the resource. |
| Server connection time | millisecond | Time taken for the network connection between the client requesting the resource and the server. |
| Size | Byte | Data size of the requested resource. |
| Environment | Text | Operating environment where the resource is loaded. e.g. development environment, operating environment, etc. |
| DNS time | millisecond | Time taken to query the domain name. (Time from domainLookupStart to domainLookupEnd) |
| FirstByte time | millisecond | Time taken until the first byte is received from the server. (Time from requestStart to responseStart) |
| SSL time | millisecond | Time taken for TLS handshaking when connecting via HTTPS. (Time from connectEnd to secureConnectionStart) |
For more information about Navigation timing, see the following.