Service 2.12.X
Service 2.12.8
January 20, 2025
Common
Fixed Fixed the issue where the changed time is not applied when the search button is selected after changing the time by using the keyboard in the time selector.
Application
Fixed In Statistics > Transaction, fixed the issue where the displayed date at the top of the pop-up window is not changed when using the Trend comparison feature.
Service 2.12.7
January 9, 2025
Common
Fixed In Integrated Flex Board or Flex Board, fixed the issue where the notification sound is generated for every update in the notification list widget in real-time query mode
Service 2.12.6
January 9, 2025
Application
Fixed In Dashboard > Application Dashboard, fixed the issue where the agent filters are not applied in the Active transaction popup window.
The Active transaction pop-up window can be checked when the Active Transaction Speed Chart and Active Transaction widgets are clicked.
Service 2.12.5
January 8, 2025
Application
Fixed In Analysis > Transaction Search, fixed the issue where the content of the OS column does not appear.
Service 2.12.4
January 3, 2025
Common
Fixed In Integrated Flex Board or Flex Board, fixed the issue where handling the time selector after a change of the dashboard causes the dashboard to be reset to the previous state.
Service 2.12.3
December 27, 2024
Database
Fixed In the series chart of Dashboard > Monitoring Multiple Instances, fixed the issue where the data for the linked cloud metrics does not appear.
Service 2.12.2
December 26, 2024
Application
-
FixedUpon reentry to Dashboard > Application Dashboard, fixed the issue where the data is not displayed. -
FixedIn the Hitmap widget of the Dashboard > Application Dashboard menu, fixed the issue where the time selector and the x-axis of the chart are not set to the time value of the retrieved data when the Analysis > Hitmap menu appears.
Service 2.12.1
December 24, 2024
 button of the widget.
Service 2.12.0
December 24, 2024
Common
-
FeatureReplaced components of the time selector in each individual menu.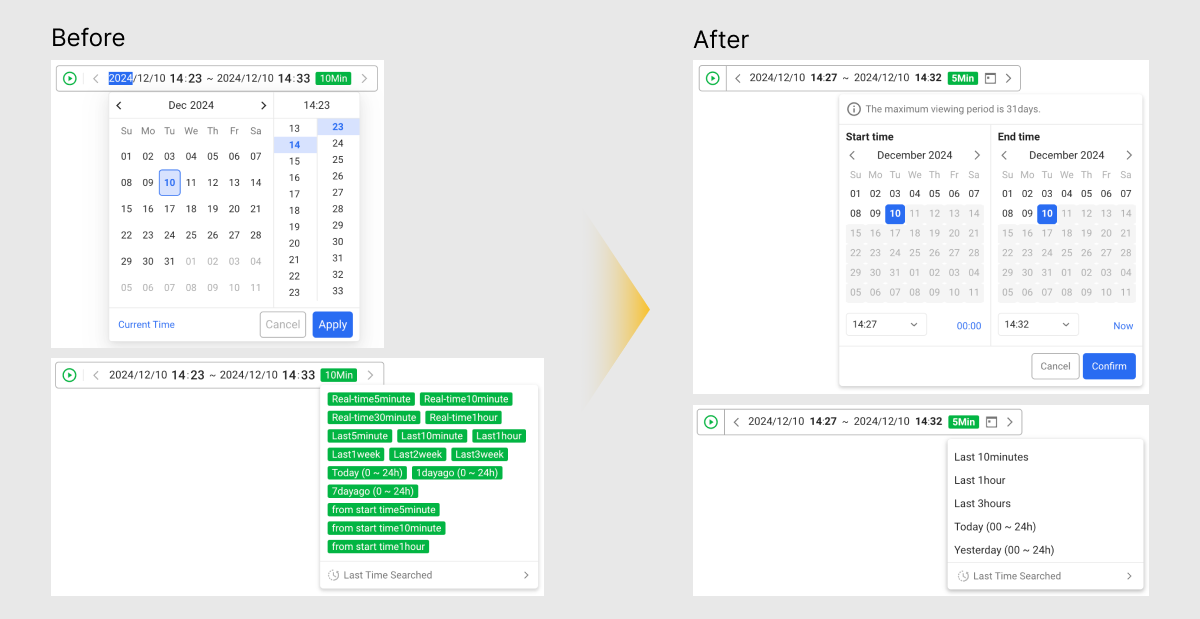
-
The date and time can be changed using the keyboard.
-
You can change the date and time by copying and pasting the text.
NoteFor more information on how to use the time selector, see the following.
-
-
FeatureIn Flex Board or Integrated Flex Board, added the following features in the Alert list widget.-
Added the View resolved events option.
-
Added the option to select a query time independent of the time set on the dashboard.
NoteFor more information about the Alert list widget, see the following.
-
-
FeatureAdded the following features in Analysis > Metrics ChartNew.-
Different UI display depending on whether the widget legend is to be shown on the dashboard
On: Widget with a fixed legend panel
Off: Widget with a legend panel provided as a drop-down
-
Legend filtering of widgets
-
Highlighting the chart line when hovering over the legend of the widget
-
When there are many chart lines, provided the feature so that the graph color does not become blurred.
NoteFor more information about the legend for the metrics widget, see the following.
-
-
FeatureIn Alert > Event ConfigurationNew, added the description to the Resolved notification option. -
FeatureIn Alert > Notifications, added the Smart message (AI) option to send notification messages with user-friendly content via AI.NoteFor more information about the Smart message (AI) option, see the following.
-
ChangedIn the Flex Board menu of the project, removed Project name among the dashboard list sorting options. -
ChangedIn the event addition or modification screen of the Alert > Event Configuration menu, modified to test by applying the event reception tag selection items when the Test alert feature is run.NoteNotifications that occur in web browsers are independent of the event receiving tags.
-
ChangedIn the event addition or modification screen of the Alert > Event Configuration > Metrics tab, modified to apply${ }to all fields when Selector is selected for the Event rule option.Note-
However, it is not applied if the field name contains
{or}. -
It is applied only when adding or modifying an event.
-
-
FixedIn Account Management, fixed the issue where the Notification language setting is displayed as "ja." -
FixedFixed the missing or misspelled title at the top of the screen in some menus.
Application
-
FeatureIn the Table view tab of the Trace analysis window, added the bind variable copying feature when checking the SQL information details.Note-
This feature can be used in Correlated DB information.
-
It can be used when the password is released and the bind variable value is visible.
-
For more information about the bind variable copying and pasting, see the following.
-
-
FeatureIn Statistics > Transaction, added the Trend comparison feature that allows you to see the information details by selecting multiple transactions.Note-
Up to 100 transactions can be selected for a view.
-
For more information about Trend comparison, see the following.
-
-
FeatureIn Alert > Event ConfigurationNew, added the Agent duplication alert option for the application.NoteFor more information about the Agent duplication alert option, see the following.
-
ChangedAdded the download and related texts for agent installation files for .NET platforms using the versions less than .NET 4.6.1 or Windows 2008. -
FixedIn the Today's visits widget of the Dashboard > Application Dashboard menu, fixed the issue where the today's maximum value does not appear when the presious day's maximum value is greater than that of today's.
Server
-
FeatureIn Server List > Server Inventory, added the feature that replaces the custom columns in the server list by uploading a CSV file.NoteFor more information about the CSV file uploading feature, see the following.
-
ChangedIn Dashboard > Server Inventory Map, changed the initialization method for the grouping option selection tools.Changed from clicking the Clear button to selecting Not set. from the list.
-
ChangedChanged the Filter option UI of the Server List > Server Inventory menu to be the same as the Filter option of the Server Inventory Map menu. -
ChangedIn Management > Agent Installation > HP-UX, added the agent download button for IA64 Kernel 11.31. -
FixedIn the group summary panel of the Dashboard > Server Inventory Map menu, fixed the issue where the Server uptime chart is intermittently clicked. -
FixedIn Dashboard > Server Inventory Map, fixed the bug where a previous time can be selected after replacing the time selector components. -
FixedIn Server List > Server List, fixed the bug where the time appears as NaN and a previous time can be selected when the real-time mode of the time selector is paused. -
FixedIn Column settings of the Server List > Server List menu, fixed the issue where all the selected columns are released when the Initialized button is clicked. -
FixedIn Server List > Server Detail, fixed the issue where the corresponding page does not appear when the agent viewed through the agent/IP search feature of the side menu is selected.
Kubernetes
-
FeatureIn the detailed information of the Cluster > Ingress List menu, added the application information. -
FeatureIn Cluster > etcd Dashboard, added the guide message modal. -
FeatureIf the version of the installed agent is less than the supported version when the Cluster > etcd Dashboard menu is entered, the display feature of the update guide screen has been added. -
FeatureAdded the link to the resource list in the Detail window in the following menu paths:-
Cluster > Node Timeline
-
Cluster > Ingress List
-
-
FeatureIn the Node configuration tab for the detailed information provided by the following menu path, added the total values for CPU, memory, and disk.- Dashboard > Node Map
- Cluster > Node List
- Cluster > Node Timeline
-
ChangedIn the Management > Project Management menu for the namespace project, modified not to change the projeet name.
Database
Common
-
FeatureProvided the pagination feature in the Active sessions table.- Dashboard > Monitoring a Database Instance
- Dashboard > Monitoring Multiple Instances
-
FeatureAdded the feature to check the result from the User Behavior menu when a user updated the agent in Management > Agent Update.NoteThis feature is applied to platforms other than Oracle Pro.
-
FeatureAdded the feature to check the result from the User Behavior menu when a user executed SQLs in Laboratory > Script Manager.NoteThis feature is applied to platforms other than Redis and MongoDB.
-
ChangedChanged the support period for the databaseV1from December 31, 2024 to June 26, 2025. -
ChangedIn Dashboard > Monitoring a Database Instance, fixed the issue where the chart appears blank when changing the real-time query range. -
FixedFixed the issue where the Active sessions table in the following menu path displays the data that exceeds the 1-minute range.- Dashboard > Monitoring a Database Instance
- Analysis > Counts Trend Comparison
Database V2
-
FeatureIn Dashboard > Monitoring Multiple Instances, added the feature to display the unit for the metric selected in the custom widget. -
FeatureIn the Correlated DB information window, added the button that pastes the bind variable value copied from the Trace analysis window for the APM project.Note-
Applied platforms: PostgreSQL, Oracle, Oracle Pro, MySQL
-
For more information about the bind variable copying and pasting, see the following.
-
-
ChangedIn Analysis > Counts Trend Comparison, changed the title of the Active sessions table.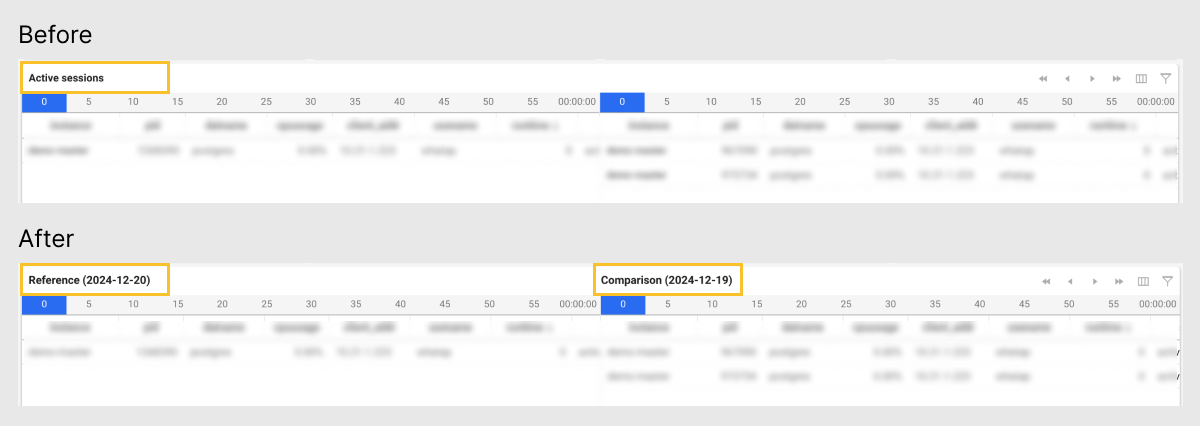
-
ChangedWhen moving to Monitoring a Database Instance from the Correlated DB information window, changed to include the start time, end time, and session period as query parameters.NoteApplied platforms: PostgreSQL, Oracle, Oracle Pro, MySQL
-
FixedIn Dashboard > Monitoring a Database Instance, fixed the issue where the Y-axis of a widget is not changed to match the changed metric. -
FixedIn Dashboard > Monitoring a Database Instance, fixed the problem where the loading indicator persists displaying if there is no data to be viewed, and added a guide message for empty data. -
FixedIn Dashboard > Monitoring a Database Instance, added the text, There are no recent views. when there is chart data but no table data. -
FixedIn the Active sessions table of the Dashboard > Monitoring a Database Instance menu, modified to display ellipsis (...) when the instance name is longer than the width of the column. -
FixedIn Dashboard > Monitoring a Database Instance, fixed the issue where full text cannot be viewed when the Session detail window is opened to view the past data.NoteApplied platforms: SQL Server
-
FixedIn Dashboard > Monitoring Multiple Instances, changed the order of instances displayed in the custom widget in the equalizer chart format to match that of the instance list at the top of the screen. -
FixedIn Analysis > Counts Trend Comparison, added the information for [Reference]/[Comparison] and instances in the widget tooltip.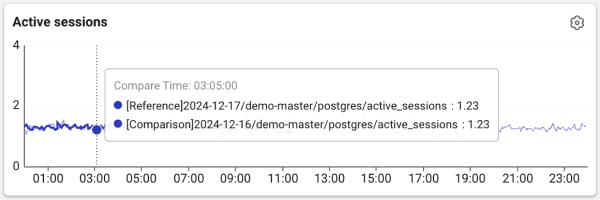
Oracle, Oracle Pro
-
FeatureIn the SQL details window of the Dashboard > Monitoring a Database Instance menu, added the active session information. -
FeatureIn the Filter option of the Analysis > SQL Analysis menu, added the condition,object_name. -
ChangedIn Dashboard > Monitoring a Database Instance, changed the style for the TOP STAT and TOP EVENT windows and the table content. -
FixedIn the Account creation step of the Management > Agent Installation menu, corrected wording in the command granting the role to query the hidden parameters.
MySQL
Fixed In the SQL details window of the Stat/Report > MYSQL SQL Statistics menu, fixed the issue where the hash value is displayed as undefined.
Browser
Feature Added the Resource Load Statistics menu to visually provide performance data for each resource and to analyze the load time, resource size, performance trends by type, and the like.
This feature can be seen in the Statistics > Resource Load Statistics path. For more information, see the following.
AWS Log
Changed In Management > Agent Installation, added the region, Jakarta into the AWS Region selection list.
Log
-
ChangedIn Log > Log Search, changed to enable the search button while loading the data. -
FixedModified to display the Close button in the log activation guidance modal.