Manager Info
In Manager Info., you can check the status and operational information of NMS managers. View collection service status, system resource usage, MIB load status, polling failure logs, and more.
Basic screen
The Manager Info. screen consists of a Manager list on the left and a Status panel on the right.
-
Select a manager in the Manager list area.
-
Check the selected manager information in the status panel on the right side of the screen.
- Panel resize: You can resize the panels by dragging the divider between the left manager list and the right status panel.
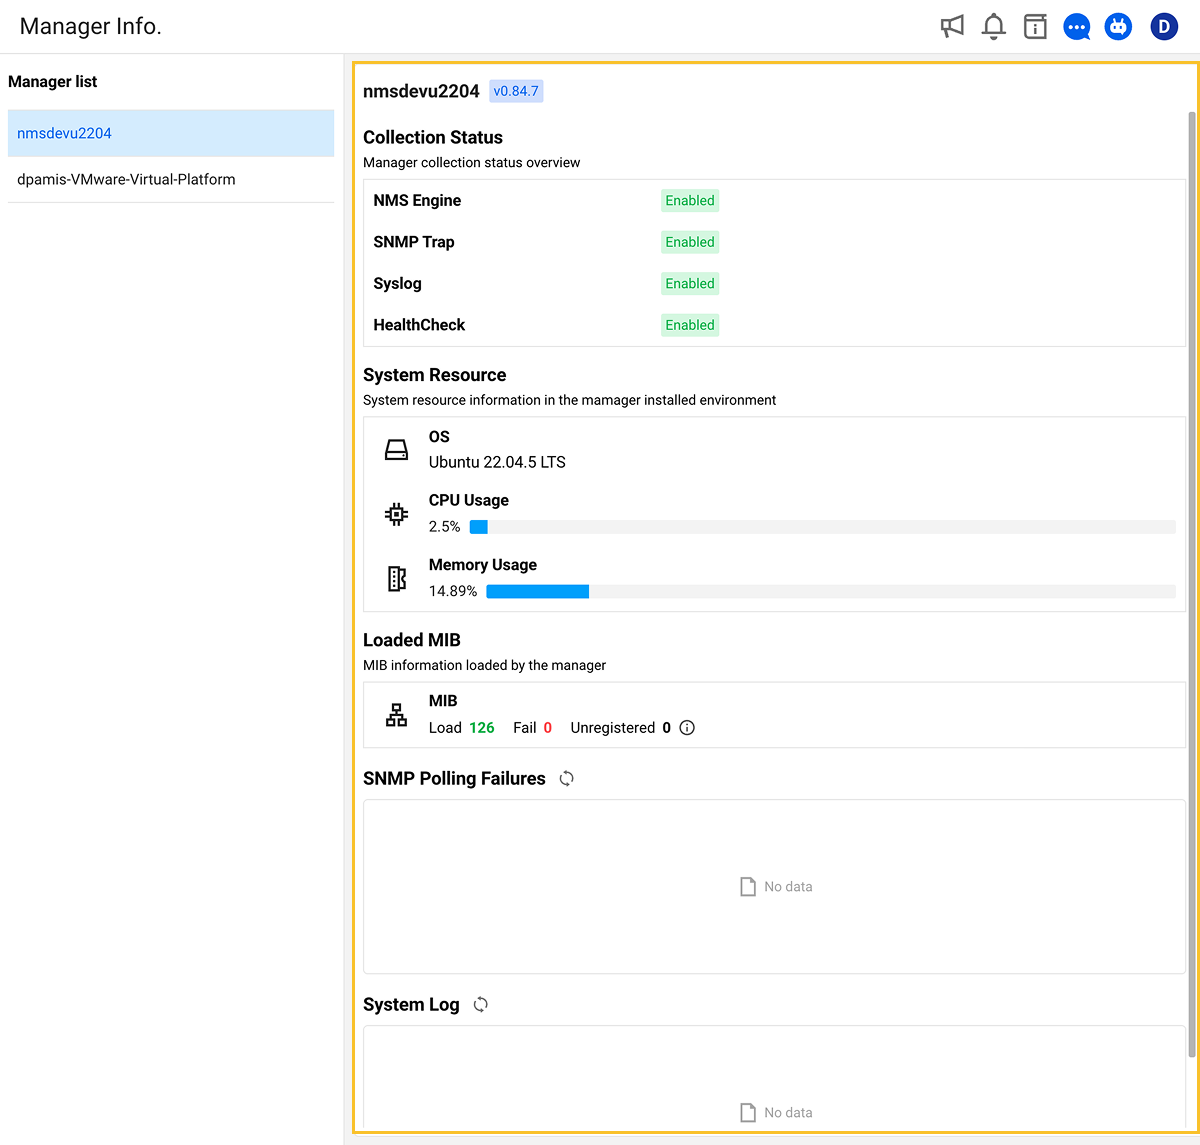
Checking manager information
You can check the operational status of the selected NMS manager through the following items.
- Selected manager info: Manager name and version information
- Collection status: Whether each collection service is active
- System resource: CPU/memory usage
- Loaded MIB: MIB file load status
- SNMP polling failures: Collection error details
- System log: Manager system logs
Selected manager info
The currently selected manager in the Manager list is highlighted so you can easily see which manager's data you are viewing.
The name and version of the selected manager are displayed at the top of the information area.
-
Manager name: Name of the selected manager
-
Version tag: Manager version (e.g.,
v1.0.0)
Collection status
In Collection Status, you can check the activation status of each collection service.
-
Enabled: Service active
-
Disabled: Service inactive
| Service | Description |
|---|---|
| NMS Engine | SNMP polling engine (core collection service) |
| SNMP Trap | SNMP Trap reception service |
| Syslog | Syslog reception service |
| ICMP | ICMP health check daemon |
System resource
In System Resource, you can check the system resource usage of the manager server.
| System resource | Description |
|---|---|
| OS | Operating system name (e.g., Ubuntu 22.04) |
| CPU Usage | CPU usage rate (shown as progress bar) |
| Memory | Memory usage/total capacity (shown as progress bar) |
Loaded MIB
In Loaded MIB, you can check the status of MIB files loaded in the manager.
-
Load: Number of MIBs loaded successfully
-
Fail: Number of MIBs that failed to load
-
Unregistered: Number of unregistered MIBs
What is Unregistered?
This refers to cases where the MIB corresponding to a registered SNMP OID has not been loaded in the manager.
SNMP polling failures
In SNMP Polling Failures, you can check the list of SNMP polling failures.
Click the  icon to re-query the latest polling failure list. A cooldown timer applies. Data is not auto-refreshed and must be queried manually via refresh.
System log
In System Log, you can check the manager system logs.
Click the icon to re-query the latest system logs. A cooldown timer applies. Data is not auto-refreshed and must be queried manually via refresh.
Daemon restart
In Daemon Restart under the Service Status & Daemon Restart tab, you can restart the daemons from the screen without connecting to the manager over SSH.
The restart always targets all daemons, in the order of NMS Engine, Health Check, and Automation. Monitoring may pause briefly during the restart.
-
Click the Restart NMS Daemon button.
-
Check the notice in the confirmation window and click the Restart button.
- While the restart request is in progress, the button is disabled to block duplicate requests.
-
When the restart is complete, the service status in Collection Status is updated immediately.
If the restart request was delivered but the service readiness could not be confirmed, a verification failure notice is displayed. In this case, check each service status again in Collection Status.