URL List
On the URL list screen, you can check the latest check results of the URLs registered in the project in real time, and add or edit URLs.
Basic options
-
Search and sorting
In the search input field on the upper left of the screen, you can search the list by URL or URL name. Clicking the sorting button next to it sorts the list by Name, Status, or Agent region name. The default setting is Name.
-
Real-time mode
The LIVE indicator on the upper right of the screen shows the last refresh time. Clicking the pause button stops real-time mode, and clicking the refresh button retrieves the latest data immediately.
-
Project summary card
The summary card above the list shows the name of the project you are currently viewing and the number of registered URLs. The count badge is based on all URLs registered in the project, so the value does not decrease when you apply a search term or a status filter. If there is no check history yet, a message notifying that data collection is pending appears.
-
Status filter
Below the summary card, you can check the counts for each final response status and filter the list. The view can be seen based on Total, Success, Redirection, Client error, Internal server error, and Unknown. The default setting is Total view.
-
 Import /
  Export
Clicking the
Import button imports the URL list from an Excel file. Clicking the Export button downloads the current URL list as an Excel file.
Checking the URL list
You can check the monitoring check results for each registered URL. The columns are as follows.
| Column | Description |
|---|---|
| Current status code | The final check response code (HTTP Status Code). Clicking a status code takes you to the HTTP status code document. |
| Name/URL | The name entered when registering the URL and the URL to check |
| Location | The check location selected when registering the URL |
| Elapsed time | The check results for the last 20 minutes (response code and response time) and the final response time. Dragging in the chart area retrieves the response codes and response times for that time period. |
 | To change the settings of a registered URL, click the icon on the right of the row to go to Edit URL. |
 | To register a new URL with the same settings as an existing one, click the icon to go to Copy URL. The existing values such as the check location, collection cycle, and event settings are retained. Because the name and URL cannot be duplicated, change them before saving. |
 | To delete a registered URL, click the icon, and then click the Delete button in the confirmation pop-up window. |
When you delete a URL, all data collected for that URL is deleted and cannot be recovered.
Adding and editing a URL
-
Click the + Add URL button on the upper right of the screen. The Add URL panel opens on the right of the screen.
-
Clicking the expand icon on the upper right of the panel displays the panel in a wider view.
-
To cancel the addition, click the close (X) icon on the upper left.
-
Clicking the Go To The Guide link takes you to the URL settings guide document.
-
-
Enter the basic information. The items marked with an asterisk (*) are required.
Item Required Description Name Required Used as a unique identification for URL settings. Duplicates are not allowed. If you register with the same name when resetting, statistical data with the same name is considered as data from the same URL. URL Required Enter the full path of the URL to check. It supports the http/https protocol. Check location Required Select the region of the WhaTap agent that performs the check.
Available regions: California, Frankfurt, Jakarta, Mumbai, Seoul, Singapore, TokyoRegion IP - The IP address of the agent in the selected region appears. Because the connection is attempted from that IP address to check the URL, check your firewall rules and allow access if necessary. For more information, see Selecting a region. Collection cycle Required The interval to collect monitoring data.
- Default value: 1 Minute(60000 ms); you can select up to 5 minutes in 1-minute increments. -
In the Event configuration area, set the alert conditions for each URL. Use the toggle for each condition to specify whether to use it.
- You can enter an alert message of up to 50 characters. The message you enter is delivered with the alert content.
Item Description Status Sends an alert based on the response status of the check result. Turn on the toggle and then select the target statuses.
- You can select multiple items among Client error, Internal server error, and Unknown.Elapsed time Sends an alert based on the check response time. Turn on the toggle and then enter the threshold in seconds. An alert is sent when a response time exceeding the entered value occurs.
You can specify a minimum of 5 seconds, and you can adjust the value with the + and - buttons. -
After configuration, click the Save button.
- It takes about 1 minute for the added/modified/copied URL to be reflected in the list.
The registered URL also appears as an alert target in the Classic area of the Event Configuration screen. For more information, see the following.
Selecting a region
We can provide additional regions for future connectivity testing. For additional regions, contact us at support@whatap.io.
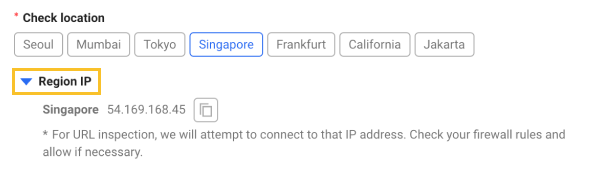
For access testing to a closed network site, you may need to open the firewall to allow calls from the agent. The location IP address appears If Region IP is selected. Firewall open target IP addresses of each agent are as follows:
Agent IPs by region when using the Seoul region project
-
AWS-Seoul-Agent - 54.180.11.176
-
AWS-Mumbai-Agent - 3.6.243.66
-
AWS-Tokyo-Agent - 18.179.189.142
-
AWS-Singapore-Agent - 54.169.168.45
-
AWS-Frankfurt-Agent - 18.197.22.141
-
AWS-California-Agent - 54.215.76.203
-
AWS-Jakarta-Agent - 16.78.204.227
Agent IPs by region when using the Tokyo region project
-
Seoul - 54.180.11.176
-
Mumbai - 3.6.243.66
-
Tokyo - 52.193.204.10
-
Singapore - 18.140.134.146
-
Frankfurt - 18.158.138.224
-
California - 13.52.131.66
-
Jakarta - 16.78.204.227
If cloudflare is used, you must allow the region IPs that are compatible with its firewall rules.
Use of WhaTap URL Monitoring service
URL Monitoring is provided as a free service until there is any change of payment policy. You do not need to install separate agents and can use the WhaTap agents and server repository.