Starting the URL Monitoring
To use the WhaTap monitoring service, after signing up in Sign up, create a project and then add the URL. For more information about registration, see the following.
See the following video guide.
Project Creation
Create a project before adding the URL.
-
Log in WhaTap monitoring service.
-
To create a project, on the left of the screen, select All Projects > + Project.
-
In Select product, create a URL monitoring project.
-
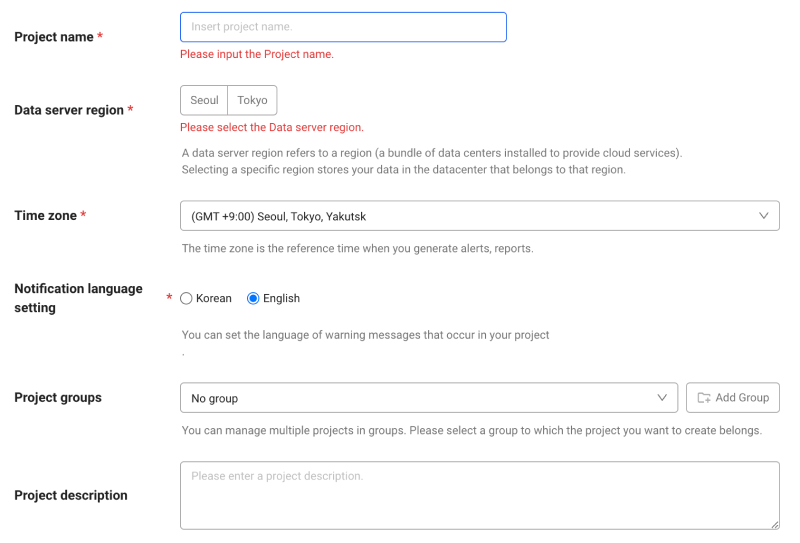
Configure the settings for Project name, Data server region, and Time zone.
-
In Notification language setting, select the language for alert messages.
-
After all settings are finished, select Creating a project.
-
Check the new project in the project list.
-
A Data server region refers to a region (a bundle of data centers installed to provide cloud services). Selecting a specific region stores your data in the datacenter that belongs to that region.
-
Time zone is the reference time for generating alerts and reports.
-
To group multiple projects for management, select a group from Project groups or add a group. For more information about grouping, see the following.
Up to 10 URL projects can be created. The number of URLs that can be registered in a URL project for free is unlimited.
Adding a URL
-
Select the generated URL project. A screen with no URL set appears.
-
Select + Add URL on the upper right of the screen.
-
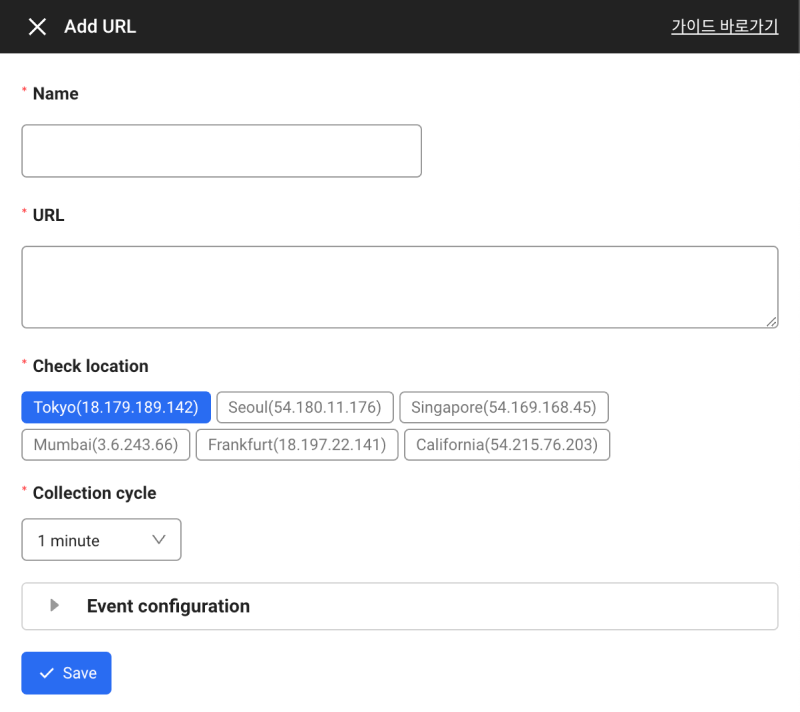
Proceed to perform URL settings in the input fields.
-
Name: Used as a unique identification for URL settings. Duplicates are not allowed, and if you register with the same name when resetting, statistical data with the name will be considered as data from the same URL.
-
URL: Register the URL to check. Enter the full path of URL to call. It supports the http/https protocol.
-
Check location: Select an agent provided by WhaTap. It provides the regions such as Seoul, Mumbai, Tokyo, Singapore,Frankfurt, Califonia, and Jakarta.
NoteSelect Region IP to check the IP address of the region. Check your firewall rules and allow the IP address if necessary. For more information, see the following.
-
Collection cycle: Set the interval to collect monitoring data. The default value is 1 Minute(60000 ms). You can select up to 5 minutes in 1-minute increments.
-
-
After configuration, select Save.
-
It takes about 1 minute for the added/modified/copied URL to be reflected in the list.
-
For more information about Event configuration, see the following.
Selecting a region
We can provide additional regions for future connectivity testing. For additional regions, contact us at support@whatap.io.
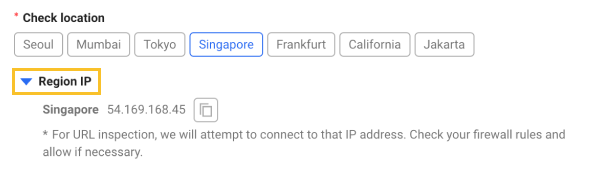
For access testing to a closed network site, you may need to open the firewall to allow calls from the agent. The location IP address appears If Region IP is selected. Firewall open target IP addresses of each agent are as follows:
-
AWS-Seoul-Agent - 54.180.11.176
-
AWS-Mumbai-Agent - 3.6.243.66
-
AWS-Tokyo-Agent - 18.179.189.142
-
AWS-Singapore-Agent - 54.169.168.45
-
AWS-Frankfurt-Agent - 18.197.22.141
-
AWS-California-Agent - 54.215.76.203
-
AWS-Jakarta-Agent - 16.78.204.227
If cloudflare is used, you must allow the region IPs that are compatible with its firewall rules.
Running Monitoring
Condition setting option
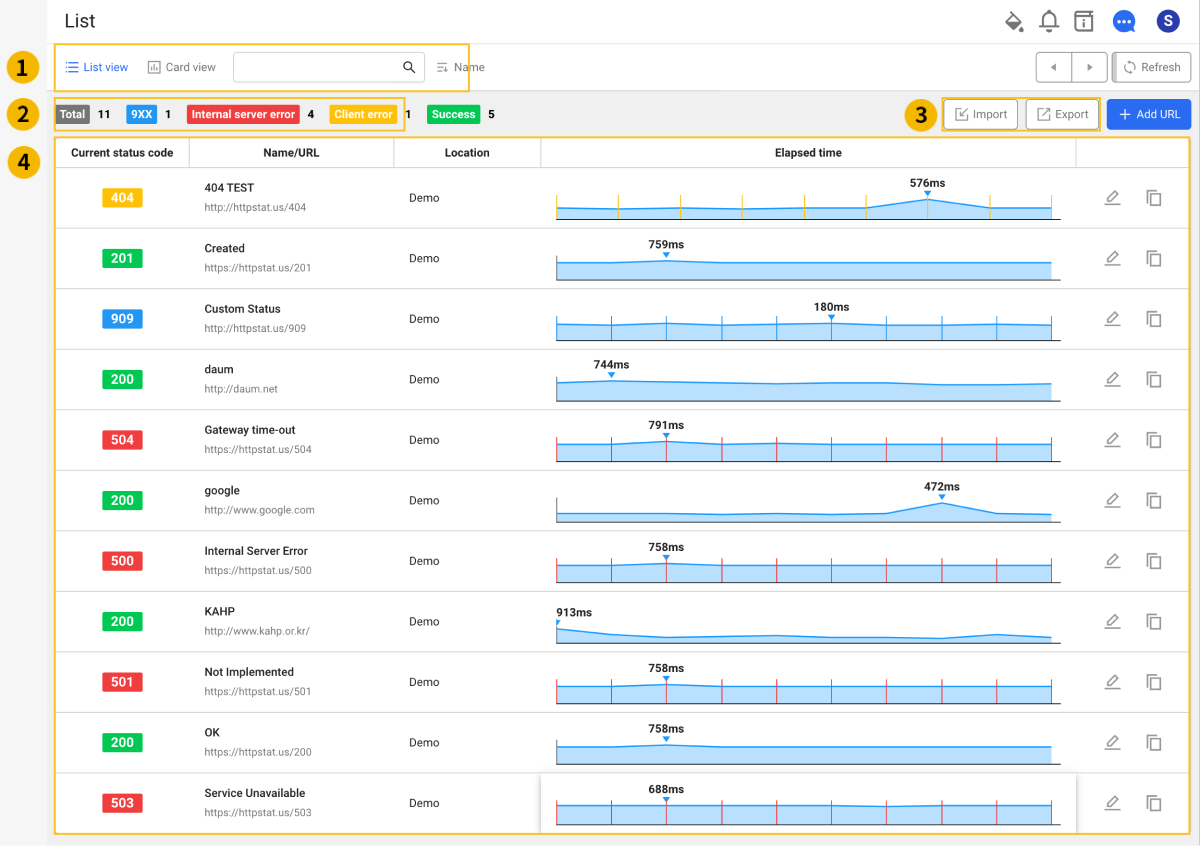
Select a project at Home screen and go to URL list. Through the option at the top of ![]() , you can specify the view format and sorting method, or view the list through search.
, you can specify the view format and sorting method, or view the list through search.
-
 List view: You can view the URL list in the list format. The default setting is List view.
 -
 Card view: You can view the URL list in the card format.
 -
Search: You can search based on the URL or the name of the specified URL in the input field.
In the ![]() area, you can see and filter the counts for each final response status in the list of registered URLs. The view can be seen based on Total, 9XX, Internal server error, Client error, Redirection, and Success. The default setting is Total view.
area, you can see and filter the counts for each final response status in the list of registered URLs. The view can be seen based on Total, 9XX, Internal server error, Client error, Redirection, and Success. The default setting is Total view.
Exporting and importing URL List
In the ![]() area, you can export or import the current URL list in Excel format.
area, you can export or import the current URL list in Excel format.
-
 Import: By selecting an Excel file, the URL list is imported.
 -
 Export: The current URL list is downloaded in an Excel file through the web browser.
URL Monitoring Detail
In the URL list table of the ![]() area, you can see the monitoring check results for each registered URL. The columns are as follows. To register or edit a URL, select
area, you can see the monitoring check results for each registered URL. The columns are as follows. To register or edit a URL, select ![]() Edit URL to switch to the editing screen.
Edit URL to switch to the editing screen.
-
Current status code
It is the final check response code (HTTP Status Code). If you select each status code, the HTTP status code cleanup document appears.
-
Name/URL
This is the unique ID and URL specified upon registration of the URL.
-
Location
Check location.
-
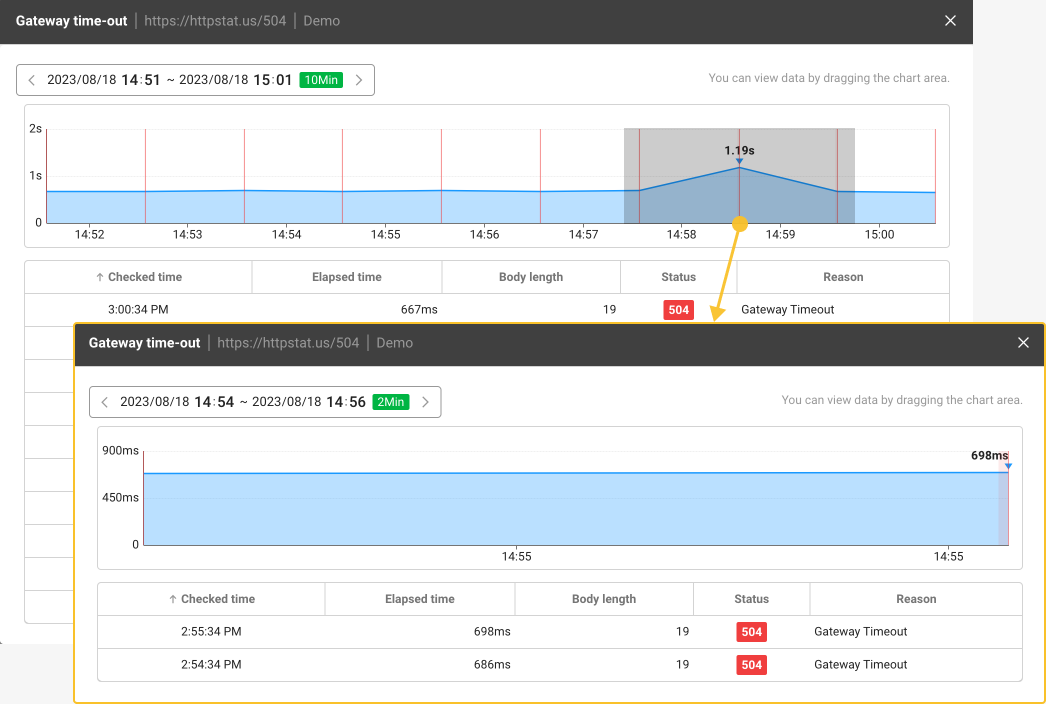
Elapsed time
It has the 20-minute check result (response code and time) and final response time. When searching for a time range by dragging in the chart area, you can see the response codes and response times for the time period as follows.
Use of WhaTap URL Monitoring service
URL Monitoring is provided as a free service until there is any change of payment policy. You do not need to install separate agents and can use the WhaTap agents and server repository.