Correlated project management
Home > Select Project > Management > Correlated Project Management
If you have created a database monitoring (DPM) project and an application monitoring (APM) project, you can relate the two projects for monitoring the data collected from DPM in the APM project.

The Correlated Project Management feature allows you to go beyond product-/equipment-centric monitoring and view monitoring data across multiple projects. This is useful for analyzing how different system components such as applications and databases, interact together. In particular, when performance degradation occurs, you can quickly determine whether it is a hardware problem or an individual application problem, which can significantly reduce the troubleshooting time. Through Correlated Project Management, you can comprehensively analyze performance data at the user system level and obtain more visible insights.
Notes before you begin
-
The database platforms that support the Correlated project feature are as follows:
PostgreSQL, Oracle, MySQL, SQL Server, CUBRID, Altibase, Redis, MongoDB
-
The Correlated DB session feature requires Java agent 2.2.33 or later. Database platforms that support this feature are as follows:
PostgreSQL, Oracle, Oracle Pro, MySQL
Role configuration
For Oracle and Oracle Pro platforms, the following roles are required to add linked projects.
grant select on sys.v_$session to DB access account;
# ex) grant select on sys.v_$session to petapp;
Adding any linked project
-
Go to Management > Correlated Project Management.
-
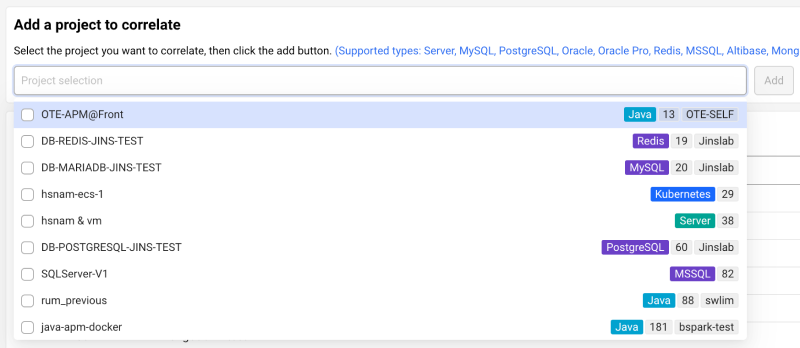
In the Add a project to correlate section, select the Project selection input field.
-
If you see a list of projects, select a project to link to. You can also enter a string to search for matching projects.
-
Select one or more projects and then select Add that is active.
The selected project is added in Correlated project list.
You need the Edit role on the project to add a linked project. If you have the Edit role, the Add button is enabled in the Correlated Project Management menu.
Setting the agent options
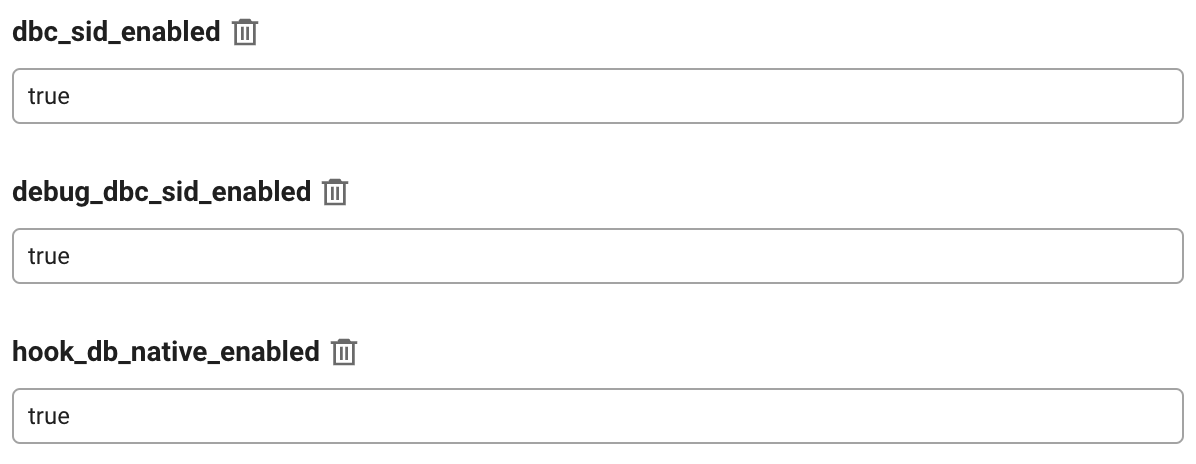
For the database project and associated analysis, set the options in the agent configuration file (whatap.conf) as follows. Or configuration is possible in Management > Agent CONF..
dbc_sid_enabled=true
hook_db_native_enabled=true
debug_dbc_sid_enabled=true
-
dbc_sid_enabled bool
Default
falseThis option is used to issue an SID. Set the value to
truefor associated analysis. It is the Required option. -
hook_db_native_enabled bool
Default
falseThis option is used to extract the DB type used in the transaction. Set the value to
truefor associated analysis. It is the Required option. -
debug_dbc_sid_enabled bool
Default
falseIt is optional to write the SID-related information to the Java agent log.
Management > Agent CONF.
Checking the metrics of the linked project
Metrics related to the added project can be checked in the following menu path.
-
Dashboard > Application Dashboard
-
Dashboard > Active Transaction
-
Analysis > Hitmap
-
For more information about the Application Dashboard menu, see the following.
-
For more information about the Active Transaction menu, see the following.
-
For more information about Hitmap, see the following.
Application Dashboard
You can check the linked projects through the following widget in the Application Dashboard menu.
- Active Transaction Speed Chart
- Active Transaction
- Hitmap
Active Transaction Speed Chart / Active Transaction widget
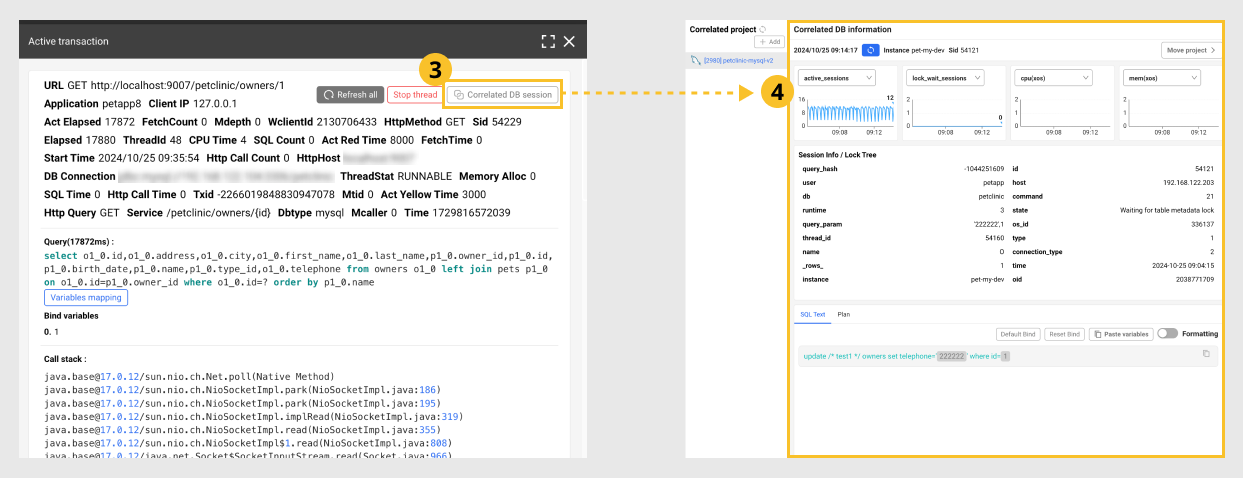
You can query the SQL performance of the database associated with active transactions. Go to Dashboard > Application Dashboard.

-
On the dashboard, click the chart area of the Active Transaction Speed Chart or Active Transaction widget.
-
When the Active transaction window appears, select transactions.
-
When the transaction details window appears, select Correlated DB session on the upper right.
-
When the Correlated DB information window appears, check the related metrics.
-
The Correlated DB session button appears in the transaction details window only when the DB of the database project registered for linked analysis has executed the SQL of the selected transaction.
-
For more information about the Correlated DB information window, see the following.
-
The databases that support this feature are PostgreSQL, Oracle, Oracle Pro, and MySQL platforms.
Hitmap Widget
You can view performance metrics of the database associated with transactions from the past. Go to Dashboard > Application Dashboard.
Checking in the DB connection step


-
Drag the chart area of the Hitmap widget on the dashboard.
-
When the Trace analysis window appears, select a transaction to view.
-
When the transaction details appear on the right, select the Table view tab.
-
In the DB Connection step, select
.
-
When the Instance Dashboard window of the linked project appears, check the related metrics.
-
The
button appears on the Table view tab only when the DB of the database project registered for linked analysis executes the SQL statement of the selected transaction.
-
For more information about the Instance Dashboard window, see the following.
-
For more information about the Trace analysis window, see the following.
-
The databases that support this feature are PostgreSQL, Oracle, Oracle Pro, and MySQL platforms.
Checking in the SQL step

-
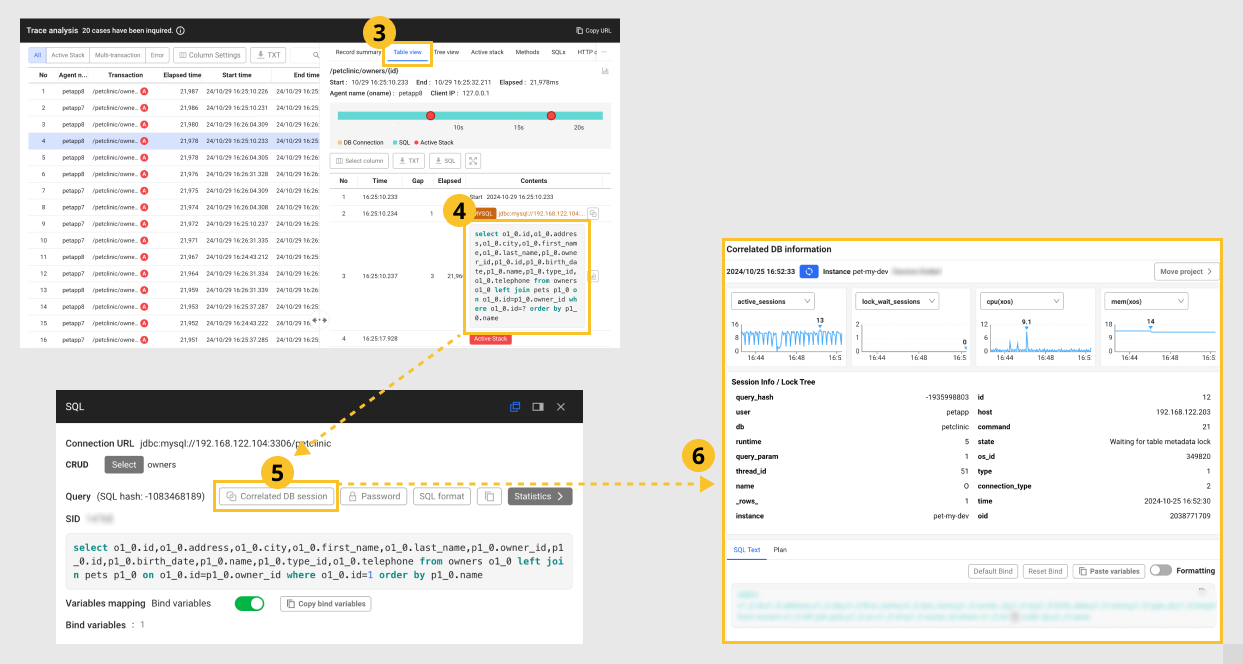
Drag the chart area of the Hitmap widget on the dashboard.
-
When the Trace analysis window appears, select a transaction to view.
-
When the transaction details appear on the right, select the Table view tab.
-
Select a SQL statement in the SQL step.
-
If the SQL window appears, select Correlated DB session.
-
When the Correlated DB information window appears, check the related metrics.
-
The Correlated DB session button appears in the SQL window only when the DB of the database project registered for linked analysis executes the SQL statement of the selected transaction.
-
For more information about the Correlated DB information window, see the following.
-
The databases that support this feature are PostgreSQL, Oracle, Oracle Pro, and MySQL platforms.
-
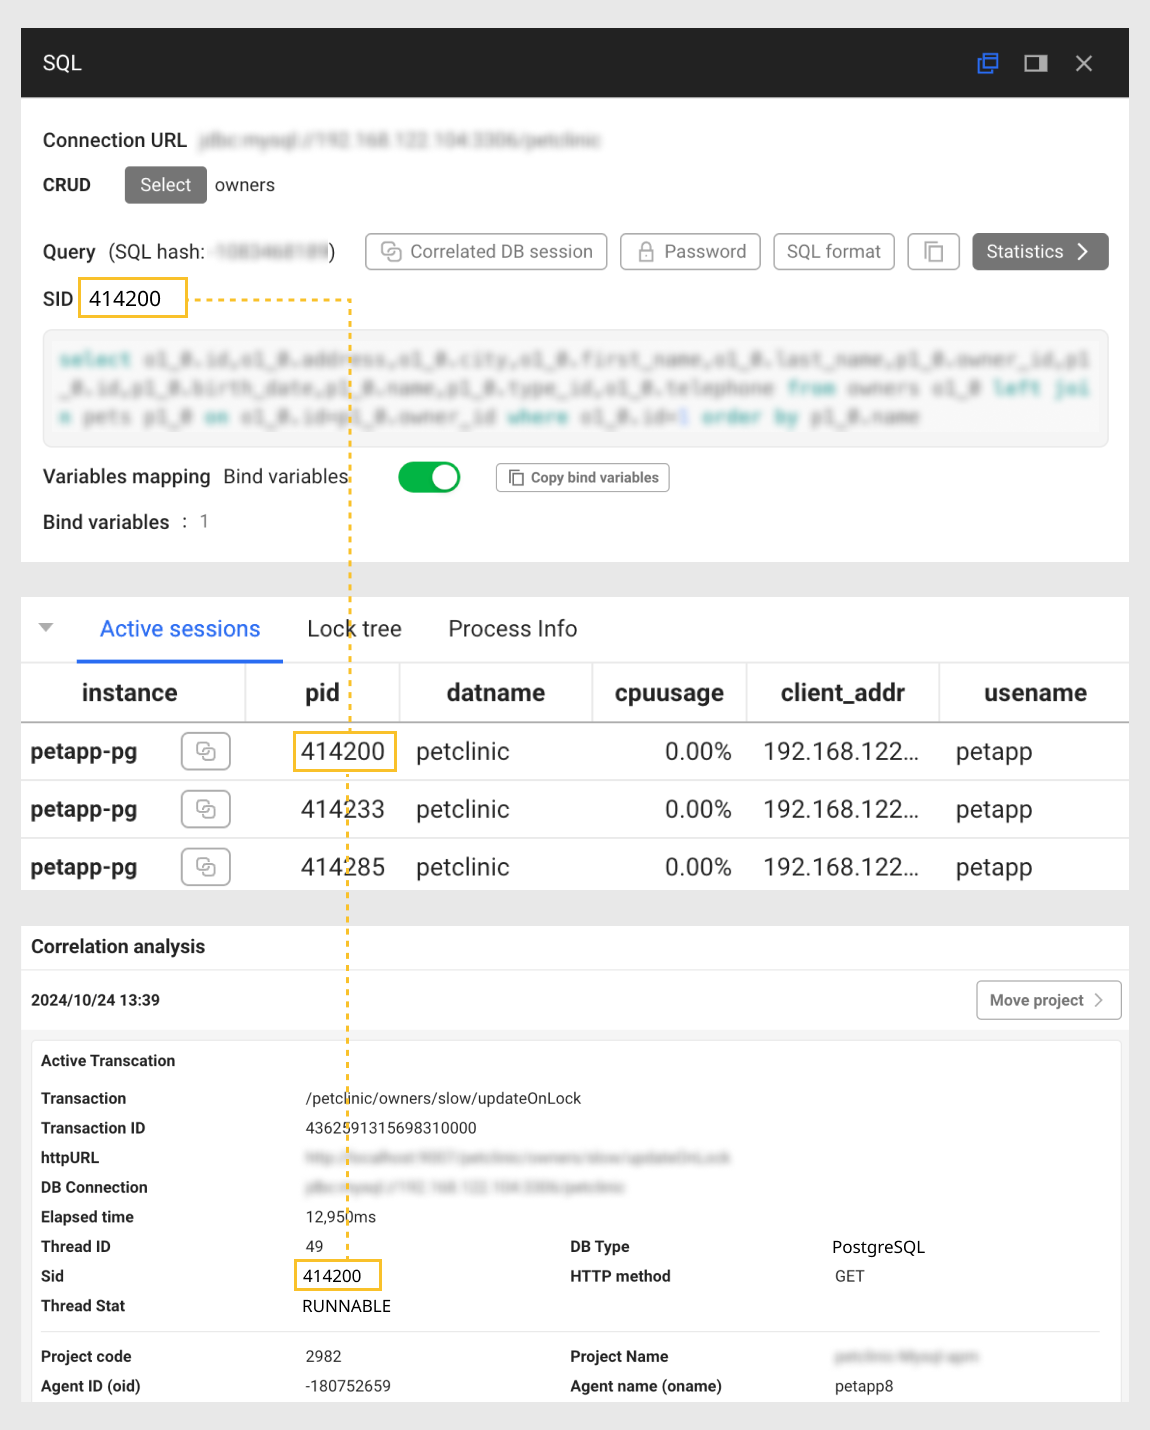
On the PostgreSQL platform, the PID entry in the Active sessions table is the same as the SID entry.
Active Transaction
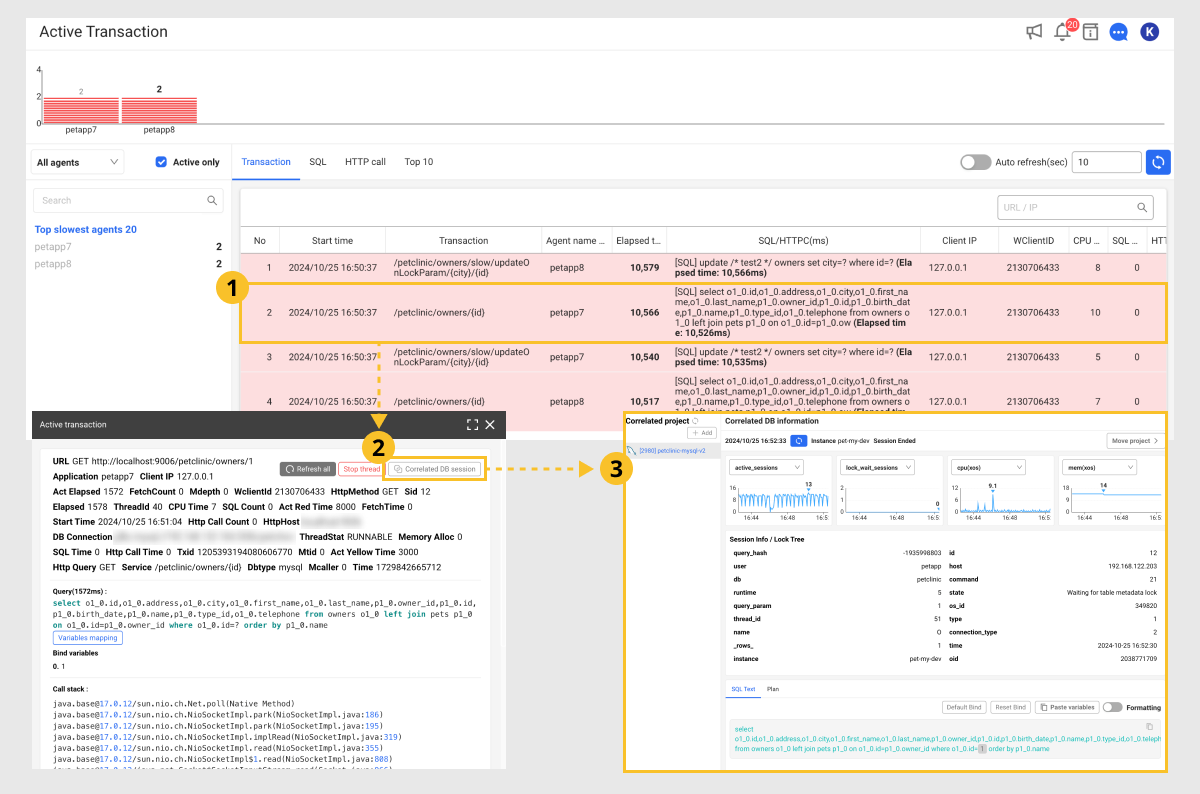
You can query the SQL performance of the database associated with active transactions. Go to Dashboard > Active Transaction.
-
Select a desired transaction to view from the transaction list.
-
When the Active transaction window appears, select Correlated DB session on the upper right.
-
When the Correlated DB information window appears, check the related metrics.
-
The Correlated DB session button appears in the Active transaction window only when the DB of the database project registered for linked analysis executes the SQL of the selected transaction.
-
For more information about the Correlated DB information window, see the following.
-
The databases that support this feature are PostgreSQL, Oracle, Oracle Pro, and MySQL platforms.
Hitmap
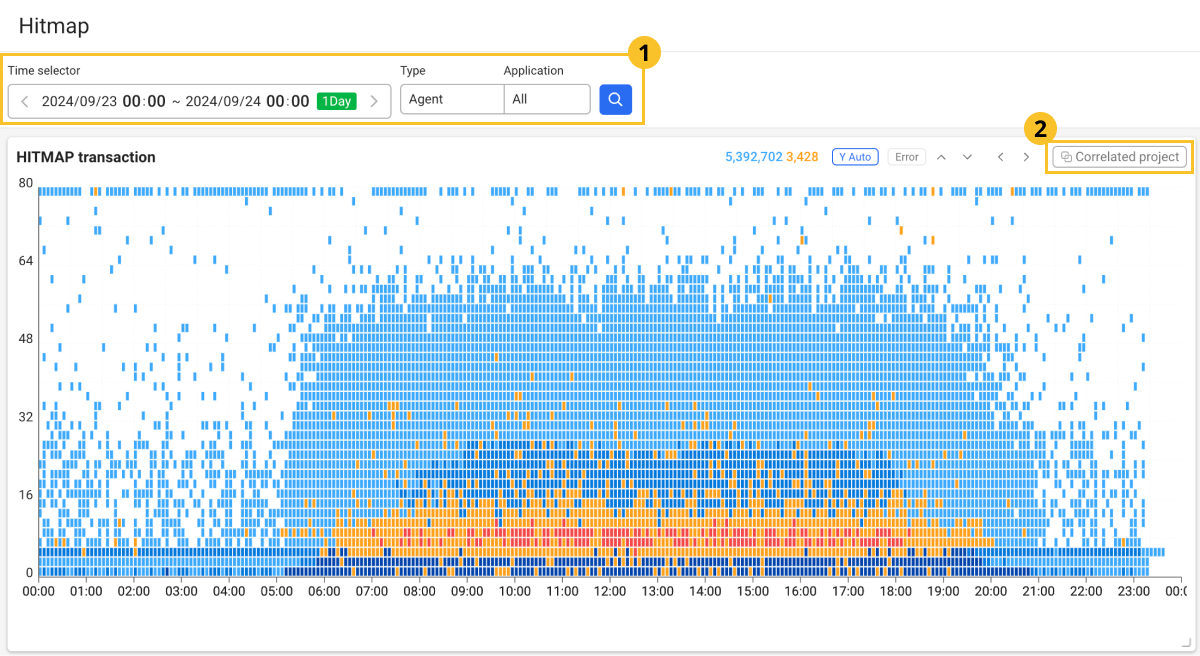
You can also see performance metrics for the linked project while viewing transactions. This feature is useful when analyzing transactions in the APM project. When you found a slow SQL, it is difficult to determine exactly in which DB the problem occurred in the environment using multiple similar DBs.
-
Set the time and Application for viewing the transactions, and then select
.
-
In the HITMAP transaction section, select Correlated project on the upper right.
-
A new window appears where you can check the metrics for the correlated project.
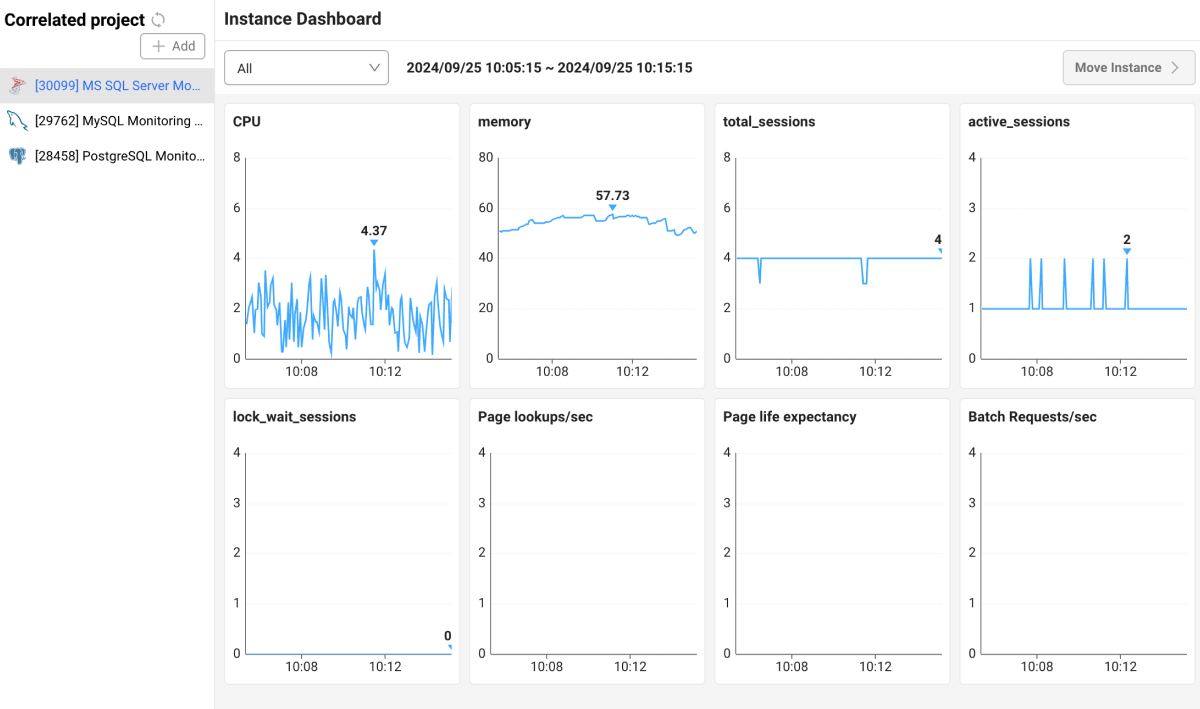
Select the correlated project from the left list and then check the metrics in the Instance Dashboard section.
For more information about the Instance Dashboard window, see the following.
Correlated DB information
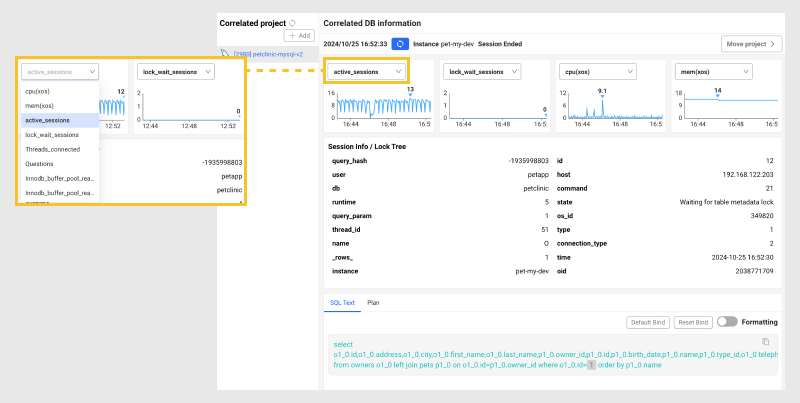
Correlated DB information allows you to check the SQL performance of the database associated with the current transaction in the application.
-
The charts at the top of the screen provide charts for key metrics of the database. You can also select other metrics by selecting the checkbox.
-
The Session Info / Lock Tree section provides various details for the database session.
Session Info / Lock Tree
-
query_hash: Unique hash value for the SQL query in progress.
-
user: User name connected to the database.
-
db: Name of the connected database.
-
runtime: Time (in milliseconds) that the session has been run.
-
query_param: Parameter used in the query.
-
thread_id: Unique identifier of the thread connected to this session.
-
name: Name associated with the session.
-
rows: Number of rows processed in the executed query.
-
state: State of the session.
-
id: Unique identifier of the current session.
-
host: IP address of the server in which the database is running.
-
command: It indicates the currently executing command or task.
-
os_id: ID of the session used in the operating system.
-
type: Type of the session.
-
connection_type: Database connection type.
-
time: Started time of the session.
-
oid: Unique ID of the instance (agent) to which the session belongs.
-
-
The SQL Text tab displays the actual content of the executed SQL query.
-
Default Bind: You can bind the part set as a variable in the query sentence to the default value.
-
Reset Bind: You can release the bound default value and check the variable.
-
Formatting: You can improve readability by applying indentation and formatting to a SQL query statement.
-
-
Plan: Plan information can be checked. Enter DB Name, User Name, and Password, and then select
.
Instance Dashboard
Instance Dashboard allows you to view key performance metrics of the database associated with the transactions executed in the application.

To navigate to the dashboard menu for a selected project, select an instance and then click Move Instance on the upper right. Go to Dashboard > Monitoring a Database Instance.
-
The HITMAP transaction button in the Correlated project section appears only when there is an associated project. For more information about adding a correlated project, see the following.
-
You can add a project by selecting Correlated project at the top of the left Add list.
-
The Move Instance button is disabled when All is selected.

-
Depending on the database product type, you can navigate to the Analysis > Counts Trend menu.
Removing any linked project
-
Go to Management > Correlated Project Management.
-
To delete a project to unlink from the Correlated project list section, select
on the utmost right of the list.
-
When the confirmation message appears, select Delete.
The deleted project is excluded from the Correlated project list section.