OpenMetrics Supported Environments
OpenAgent is a Language-Agnostic agent that can collect from any endpoint exposing Prometheus / OpenMetrics format, regardless of language or framework. It is provided as a single binary compiled in Go and can run on Linux hosts or Kubernetes clusters without installing a separate runtime.
This document summarizes the operating systems, Kubernetes versions, scraping targets, network requirements, and more that OpenAgent officially supports.
Agent execution types
| Platform | Support | Note |
|---|---|---|
| Single binary (Linux) | ✅ | AMD64 / ARM64 |
| Windows native binary | ❌ | Not supported |
| macOS (Apple Silicon) | ❌ | Not supported |
Separate runtime requirements
Since OpenAgent is a static binary built in Go, there is no need to separately install runtimes such as JVM, Node.js, or Python.
Operating system (OS)
Linux
| Architecture | Support | Download URL |
|---|---|---|
| x86_64 / AMD64 (Intel, AMD 64-bit) | ✅ | https://repo.whatap.io/openagent/latest/amd/openagent |
| ARM64 / AArch64 (Linux ARM processor) | ✅ | https://repo.whatap.io/openagent/latest/arm/openagent |
| x86 (32-bit) | ❌ | - |
Distribution compatibility
Operates on major Linux distributions based on glibc.
| Distribution | Version |
|---|---|
| Red Hat Enterprise Linux / CentOS / Rocky / AlmaLinux | 7.x or later |
| Ubuntu | 18.04 LTS or later |
| Debian | 10 or later |
| Amazon Linux | 2 / 2023 |
| SUSE Linux Enterprise Server | 12 or later |
Unsupported platforms
- Windows (including Windows Server)
- macOS (Intel and Apple Silicon)
- FreeBSD, OpenBSD, and other Unix variants
Container environments
Docker
| Platform | Support |
|---|---|
| Docker Engine 20.x or later | ✅ |
| containerd 1.6 or later | ✅ |
| CRI-O | ✅ |
Scraping targets (Exporter)
OpenAgent can collect from all Exporters and applications that expose Prometheus /metrics endpoints.
Supported metric formats
| Format | Support | Note |
|---|---|---|
| Prometheus Exposition Format (text) | ✅ | Default |
| OpenMetrics Text Format | ✅ | application/openmetrics-text |
| Protobuf | ❌ | Not supported |
Representative supported Exporters (examples)
| Category | Exporter |
|---|---|
| System / Host | node_exporter, windows_exporter |
| Kubernetes | kube-state-metrics, kubelet, cAdvisor, kube-apiserver |
| Database | mysqld_exporter, postgres_exporter, redis_exporter, mongodb_exporter |
| Message queue | kafka_exporter, rabbitmq_exporter |
| Web server | nginx-prometheus-exporter, apache_exporter |
| GPU / AI | dcgm-exporter (NVIDIA) |
| Cloud | cloudwatch_exporter, azure_metrics_exporter |
| Application | Spring Boot Actuator, Micrometer, OpenTelemetry Collector |
Exporters not listed in the table can mostly be collected as long as they follow the Prometheus text format.
Target discovery methods
| Type | Description | Environment |
|---|---|---|
| StaticEndpoints | Direct specification of fixed IP:PORT | Host / Kubernetes (common) |
| PodMonitor | Dynamic discovery based on Pod label selectors | Kubernetes |
| ServiceMonitor | Dynamic discovery based on Service label selectors | Kubernetes |
System resource requirements (recommended)
| Item | Minimum | Recommended |
|---|---|---|
| CPU | 0.1 core | 0.5 core or more |
| Memory | 128 MB | 256 MB or more |
| Disk | 1 GB (including logs) | 5 GB or more |
Measurement basis: 10 endpoints, approximately 100 time series per endpoint (approximately 1,000 time series total), 60-second collection interval. Under these conditions, actual measured usage is CPU average 0.003 core, memory approximately 50 MB. Minimum specifications are conservative values that account for burst and expansion headroom.
Actual resource usage by endpoint count
Results measured by scraping the same Exporter (83 time series per endpoint) at a 60-second collection interval while increasing the number of endpoints.
| Endpoints | Total time series / min | CPU average | Memory (RSS) |
|---|---|---|---|
| 1 | 83 | 0.002 core | approx. 31 MB |
| 10 | 830 | 0.003 core | approx. 52 MB |
| 100 | 8,300 | 0.010 core | approx. 70 MB |
Scale guide
- Resource usage scales with total time series count, not number of endpoints. Up to approximately 10,000 total time series (e.g., 100 endpoints × 100 time series, 60-second interval) operates within minimum specifications.
- For exporters like
node_exporterorkube-state-metricswith thousands of time series per endpoint, calculate based on total time series count rather than endpoint count. - Reducing the collection interval (e.g., 60s → 15s) increases CPU usage proportionally for the same number of time series.
- In environments collecting hundreds or more targets or high-cardinality Exporters, CPU/Memory specifications may need to be increased.
CPU recommendation (0.5 core) note
Although average CPU usage is very low (approximately 0.003 core), the reason for recommending 0.5 core or more is bursting. At scraping time, requests and parsing for all collection targets arrive simultaneously. In Kubernetes, limiting limits.cpu to 0.1 core can cause this burst to be throttled, resulting in scraping delays and timeouts. Therefore, even if requests.cpu is 0.1 core, we recommend setting limits.cpu to 0.5 core or more.
Common supported environment
Service deployment models
You can use WhaTap Monitoring as a SaaS or on-premises (self-hosted) service. Whichever you choose, you use the same agents and the same monitoring features.
| Deployment | Support | Description |
|---|---|---|
| SaaS | ✅ | Connects to collection servers operated by WhaTap. See the firewall section for regional addresses |
| On-premises (self-hosted) | ✅ | Collection servers you build and operate yourself (air-gapped environments supported). Contact your sales representative for the scope |
You can also deploy WhaTap on-premises in air-gapped environments without internet connectivity.
Feature differences by deployment model
Whichever you choose, the monitoring features are the same. The mobile app is the only exception and is available on the service.whatap.io SaaS service only.
To use certain features on-premises, a separate agreement is required.
Supporting the browser
WhaTap Monitoring is available in web browsers and mobile Apps.
| Browser | Recommended | Supported version |
|---|---|---|
| Google Chrome | ✅ | 111 or later |
| Mozilla FireFox | ❌ | Latest version |
| Edge | ❌ | Latest version |
| Safari | ❌ | Latest version |
Support guidance
- For browser compatibility and performance reasons, the latest version of Chrome is recommended.
- The user interface (UI) is implemented using HTML5 standard technologies, so Internet Explorer is not supported.
Limitations
WhaTap’s web interface does not support mobile browsers. To access WhaTap on a mobile device, install the WhaTap app for Android or iOS. The WhaTap mobile app is optimized for mobile environments. For more information about the WhaTap mobile app, see this document.
Firewall
The WhaTap agent must be able to access the collection server through TCP port 6600. Allow access to the collection server address that is closest to the monitored target.
Source: WhaTap agent
| Cloud | Destination | Destination IP | Port |
|---|---|---|---|
| AWS | WhaTap collection server (Seoul) | 13.124.11.223 / 13.209.172.35 | TCP 6600 |
| WhaTap collection server (Tokyo) | 52.68.36.166 / 52.193.60.176 | TCP 6600 | |
| WhaTap collection server (Singapore) | 18.138.0.93 / 18.139.67.236 | TCP 6600 | |
| WhaTap collection server (Jakarta) | 108.136.91.69 / 108.137.158.44 | TCP 6600 | |
| WhaTap collection server (Thailand) | 43.209.109.219 / 43.209.48.86 | TCP 6600 | |
| WhaTap collection server (Mumbai) | 13.127.125.69 / 13.235.15.118 | TCP 6600 | |
| WhaTap collection server (California) | 52.8.223.130 / 52.8.239.99 | TCP 6600 | |
| WhaTap collection server (Virginia) | 107.23.220.101 / 54.236.221.105 | TCP 6600 | |
| WhaTap collection server (Frankfurt) | 3.125.142.162 / 3.127.76.140 | TCP 6600 | |
| Azure | WhaTap collection server (Seoul) | 52.231.66.38 / 20.194.5.115 | TCP 6600 |
| WhaTap collection server (Tokyo) | 52.246.169.54 / 20.210.27.232 | TCP 6600 | |
| Kakao | WhaTap collection server (Seoul) | 61.109.237.237 / 61.109.238.166 | TCP 6600 |
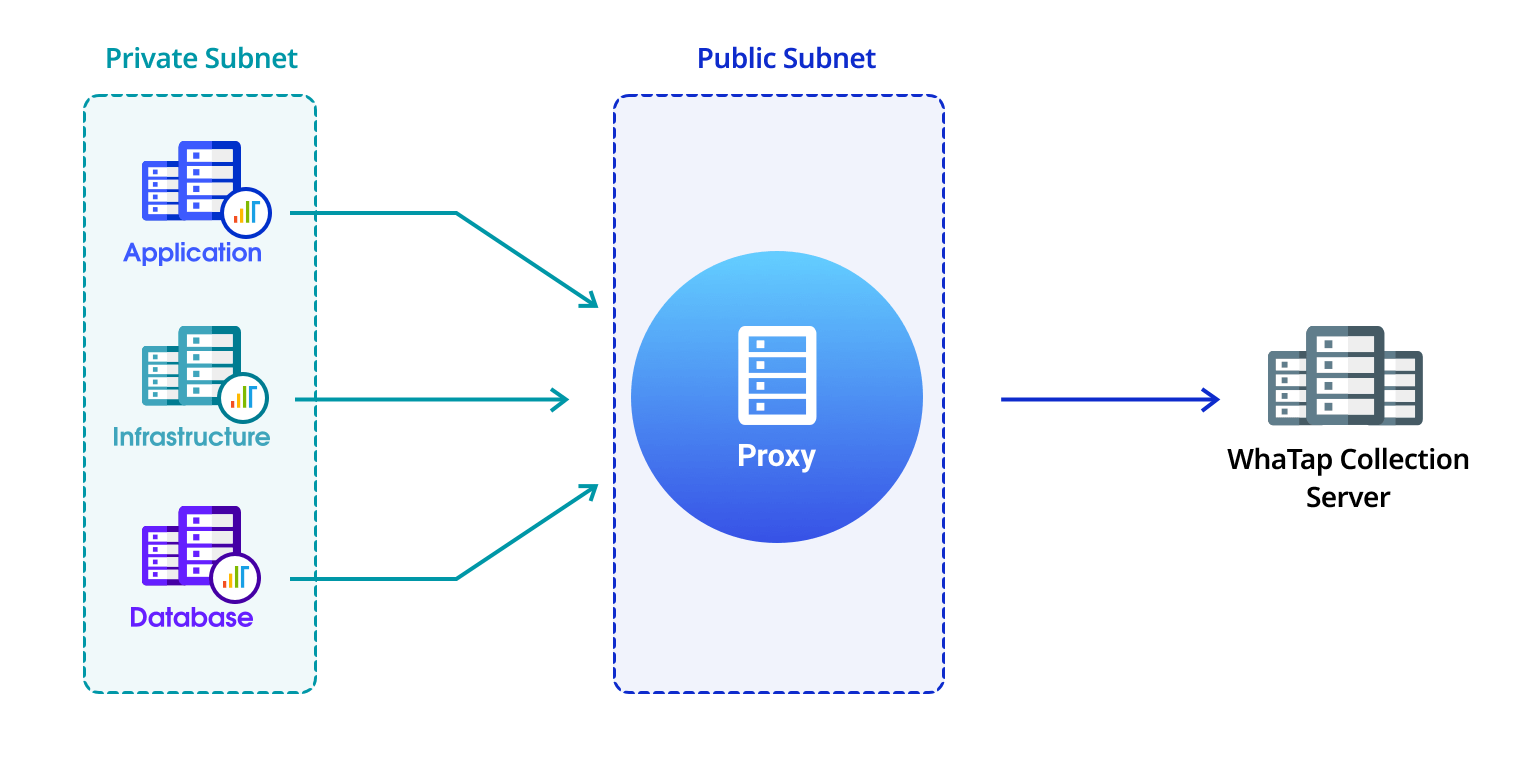
If the agent cannot directly access the collection server, use the provided proxy module to access it.