AWS CloudWatch Exporter Configuration
Cost notice for using CloudWatch Exporter
CloudWatch Exporter retrieves metrics via the AWS CloudWatch API, so AWS CloudWatch usage charges may apply depending on the number of metrics queried and the volume of API calls. Charges are based on usage of CloudWatch metrics, API requests, logs, dashboards, alarms, and more. Refer to the official AWS pricing page for details.
Prerequisites
AWS account requirements
- AWS account and console access
- Permission to create IAM policies and users
- CloudWatch metric read permission
Create an IAM policy
Create a minimum-privilege policy that allows CloudWatch Exporter to call the AWS CloudWatch API. This policy is shared across all the authentication methods below.
-
In the AWS Console, navigate to IAM → Policies → Create policy.
-
Select the JSON tab and enter the following content.
NoteThe policy below is an example. It is recommended to include only the permissions for the services you actually use.
Service Required permission Notes EC2 ec2:DescribeInstancesEBS ec2:DescribeVolumesALB/NLB/CLB elasticloadbalancing:DescribeLoadBalancersALB/NLB Target Group elasticloadbalancing:DescribeTargetGroups,elasticloadbalancing:DescribeTargetHealthRequired for collecting target group health status Auto Scaling Group autoscaling:DescribeAutoScalingGroupsRDS / Aurora rds:DescribeDBInstancesElastiCache elasticache:DescribeCacheClusters,elasticache:DescribeReplicationGroupsElastic Beanstalk elasticbeanstalk:DescribeEnvironments,elasticbeanstalk:DescribeEnvironmentHealthLambda lambda:ListFunctionsECS ecs:ListClusters,ecs:DescribeClustersS3 s3:ListAllMyBuckets{
"Version": "2012-10-17",
"Statement": [
{
"Sid": "CloudWatchReadPolicy",
"Effect": "Allow",
"Action": [
"cloudwatch:ListMetrics",
"cloudwatch:GetMetricStatistics",
"cloudwatch:GetMetricData"
],
"Resource": "*"
},
{
"Sid": "ResourceDiscoveryPolicy",
"Effect": "Allow",
"Action": [
"tag:GetResources",
"ec2:DescribeInstances",
"ec2:DescribeVolumes",
"elasticloadbalancing:DescribeLoadBalancers",
"elasticloadbalancing:DescribeTargetGroups",
"elasticloadbalancing:DescribeTargetHealth",
"autoscaling:DescribeAutoScalingGroups",
"rds:DescribeDBInstances",
"elasticache:DescribeCacheClusters",
"elasticache:DescribeReplicationGroups",
"elasticbeanstalk:DescribeEnvironments",
"elasticbeanstalk:DescribeEnvironmentHealth",
"lambda:ListFunctions",
"s3:ListAllMyBuckets",
"ecs:ListClusters",
"ecs:DescribeClusters"
],
"Resource": "*"
}
]
}Tiptag:GetResourcesis required when using theaws_tag_selectfeature. You can remove it if you do not use tag-based filtering.- Following the principle of least privilege, it is recommended to include only the permissions for the services you are actually monitoring.
-
Enter a policy name (e.g.,
CloudWatchExporterReadOnlyPolicy) and create it.
Choose an authentication method
CloudWatch Exporter uses the AWS SDK's default credential chain, which searches for credentials in the following order. Choose the method that fits your runtime environment.
Environment variables → ~/.aws/credentials file → EC2 instance profile (IMDS)
| Method | Runtime environment | Access Key | Characteristics |
|---|---|---|---|
| Method A: Access Key | All environments (including on-premises) | Required | Simple to set up; requires key management (leak/rotation risk) |
| Method B: EC2 instance profile | EC2 | Not required | Attaches a role directly to the instance. Recommended when running on EC2 |
Method C: Instance profile + role_arn | EC2 | Not required | Enables cross-account collection; separates CloudWatch permissions into a dedicated role |
The role_arn in config.yml only instructs the exporter to "assume this role" — it still requires separate base credentials to actually perform the assume (the key from Method A, or the instance profile from Method B). role_arn alone does not work.
Method A: Access Key authentication
Create an IAM user
-
In the AWS Console, navigate to IAM > Users > Create user.
-
Enter a username.
- Username:
cloudwatch-exporter
- Username:
-
Under Permissions, go to Attach policies directly and select
CloudWatchExporterReadOnlyPolicy. -
Complete the user creation.
-
In the Security credentials tab, create an access key.
-
Select Application running outside AWS as the use case.
-
Save the issued Access Key ID and Secret Access Key.
CautionThe Secret Access Key is only visible on this screen. Be sure to store it somewhere safe.
Configure AWS Credentials
Configure the authentication information that allows CloudWatch Exporter to access the AWS API.
Method 1. Environment variable
export AWS_ACCESS_KEY_ID="AKIAXXXXXXXXXXXXXXXX"
export AWS_SECRET_ACCESS_KEY="xxxxxxxxxxxxxxxxxxxxxxxxxxxxxxxxxxxxxxxx"
For persistent configuration, add to ~/.bashrc or ~/.bash_profile.
echo 'export AWS_ACCESS_KEY_ID="AKIAXXXXXXXXXXXXXXXX"' >> ~/.bashrc
echo 'export AWS_SECRET_ACCESS_KEY="xxxxxxxxxxxxxxxxxxxxxxxxxxxxxxxxxxxxxxxx"' >> ~/.bashrc
source ~/.bashrc
Storing credentials in plain text in ~/.bashrc exposes them to any user with access to that file. For production environments, Method 2 (Credentials file) is recommended.
Method 2. AWS Credentials file (recommended)
# Create directory
mkdir -p ~/.aws

# Create credentials file
cat <<EOF > ~/.aws/credentials
[default]
aws_access_key_id = AKIAXXXXXXXXXXXXXXXX
aws_secret_access_key = xxxxxxxxxxxxxxxxxxxxxxxxxxxxxxxxxxxxxxxx
EOF

# Create config file
cat <<EOF > ~/.aws/config
[default]
output = json
EOF

# Set permissions
chmod 600 ~/.aws/credentials
chmod 600 ~/.aws/config
Method A has no separate setting in config.yml. The exporter automatically discovers credentials from environment variables or the credentials file; there is no supported option for putting an Access Key directly in config.yml.
Method B: EC2 instance profile (Access Key not required)
This method attaches a role directly to the EC2 instance. Neither an Access Key nor a credentials file is required — the SDK automatically obtains temporary credentials from the instance metadata service (IMDS). Because there are no long-lived credentials, there is no risk of key leakage and no rotation burden, which aligns with AWS security best practices.
Create an IAM role
-
In the AWS Console, navigate to IAM > Roles > Create role.
-
Select AWS service > EC2 as the trusted entity.
- The trust policy is automatically configured as follows.
{
    "Version": "2012-10-17",
    "Statement": [
        {
            "Effect": "Allow",
            "Principal": { "Service": "ec2.amazonaws.com" },
            "Action": "sts:AssumeRole"
        }
    ]
} -
Select
CloudWatchExporterReadOnlyPolicyunder permission policies. -
Enter a role name (e.g.,
cloudwatch-exporter-role) and create the role.
Attach the role to the EC2 instance
In the EC2 console, select the instance, then go to Actions > Security > Modify IAM role, select the role you created, and save.
Attaching the role takes effect immediately, without rebooting the instance. However, the exporter discovers the credential chain only at startup, so if it was already running, you must restart the exporter.
Verify the role attachment
# Issue an IMDSv2 token, then check whether a role is attached
TOKEN=$(curl -sX PUT "http://169.254.169.254/latest/api/token" -H "X-aws-ec2-metadata-token-ttl-seconds: 60")
curl -s -H "X-aws-ec2-metadata-token: $TOKEN" http://169.254.169.254/latest/meta-data/iam/security-credentials/
# → If the role name is printed, the attachment is correct (404 means it is not attached)

aws sts get-caller-identity
# → Confirm the output shows "Arn": "arn:aws:sts::<account-id>:assumed-role/<role-name>/..."
With Method B, do not set role_arn in config.yml. The permissions of the role attached to the instance are used as-is. Specifying the same role that is already attached to the instance as role_arn causes it to try to assume itself, resulting in a 403 error.
Method B also requires no separate setting in config.yml. The credentials for the role attached to the instance are automatically retrieved from IMDS.
Method C: Instance profile + role_arn (AssumeRole)
This method keeps only the minimum permission (sts:AssumeRole) on the instance role and separates the CloudWatch read permission into a dedicated role. Specifying a role from a different account in the role_arn of config.yml also enables cross-account monitoring. Two roles are required.
How it works
Instance role (IMDS) → Calls sts:AssumeRole → Obtains temporary credentials for the target role → Calls the CloudWatch API
| Role | Purpose | Attached policy |
|---|---|---|
Instance role (e.g., cloudwatch-exporter-instance-role) | Attached to the instance; performs the assume | sts:AssumeRole permission only |
Target role (e.g., cloudwatch-read-role) | CloudWatch read access | CloudWatchExporterReadOnlyPolicy |
Prepare the instance role
As in Method B, create an EC2 role (cloudwatch-exporter-instance-role) and attach it to the instance, but attach only the inline policy below instead of the CloudWatch policy.
{
    "Version": "2012-10-17",
    "Statement": [
        {
            "Effect": "Allow",
            "Action": "sts:AssumeRole",
            "Resource": "arn:aws:iam::<account-id>:role/cloudwatch-read-role"
        }
    ]
}
Create the target role
-
In the AWS Console, navigate to IAM > Roles > Create role and select AWS account as the trusted entity. For cross-account access, enter the target account ID.
-
Attach
CloudWatchExporterReadOnlyPolicyunder permission policies. -
Enter a role name (e.g.,
cloudwatch-read-role) and create the role. -
On the created role, go to the Trust relationships tab, edit the trust policy, and specify the instance role as the Principal.
{
    "Version": "2012-10-17",
    "Statement": [
        {
            "Effect": "Allow",
            "Principal": {
                "AWS": "arn:aws:iam::<account-id>:role/cloudwatch-exporter-instance-role"
            },
            "Action": "sts:AssumeRole"
        }
    ]
} -
On the role summary page, go to IAM > Roles > (role name) and copy the ARN. You will use this value for
role_arnin config.yml.arn:aws:iam::<account-id>:role/cloudwatch-read-role
Both configurations are required. If the instance role does not have the AssumeRole permission, or the target role's trust policy does not include the instance role, an is not authorized to perform: sts:AssumeRole 403 error occurs.
Verify AssumeRole
aws sts assume-role \
  --role-arn arn:aws:iam::<account-id>:role/cloudwatch-read-role \
  --role-session-name test
# If temporary credentials (AccessKeyId/SecretAccessKey/SessionToken) are printed, it is working correctly
The SDK automatically refreshes the temporary credentials (1 hour by default), so no separate rotation work is needed.
Configure role_arn in config.yml
role_arn is a top-level key, not a field under metrics. Set it to the ARN of the target role you copied in Create the target role. Of the three authentication methods, only Method C requires a setting in config.yml.
region: ap-northeast-2
role_arn: arn:aws:iam::<account-id>:role/cloudwatch-read-role
# For cross-account collection, you can specify a role ARN from a different account
metrics:
  - aws_namespace: AWS/EC2
    aws_metric_name: CPUUtilization
    aws_dimensions: [InstanceId]
    aws_statistics: [Average]
Set role_arn to the ARN of the target role (cloudwatch-read-role). Specifying the ARN of the role attached to the instance causes it to try to assume itself, resulting in a 403 error.
Install Java
CloudWatch Exporter requires Java 11 or later. (Reference: CloudWatch Exporter GitHub)
-
Amazon Linux 2 / CentOS / RHEL
# Install Amazon Corretto 11 (Amazon Linux 2)
sudo yum install -y java-11-amazon-corretto-headless

# Or install OpenJDK 11
sudo yum install -y java-11-openjdk-headless -
Ubuntu / Debian
sudo apt update
sudo apt install -y openjdk-11-jre-headless
Install CloudWatch Exporter
Create working directory
sudo mkdir -p /opt/cloudwatch-exporter
sudo chown $USER:$USER /opt/cloudwatch-exporter
cd /opt/cloudwatch-exporter
Download JAR file
The latest version is available on GitHub Releases.
# Check the latest version on the GitHub Releases page below and set it in VERSION.
# https://github.com/prometheus/cloudwatch_exporter/releases
VERSION="0.16.0"

# Download JAR file
wget https://github.com/prometheus/cloudwatch_exporter/releases/download/v${VERSION}/cloudwatch_exporter-${VERSION}-jar-with-dependencies.jar

# Create a symbolic link to simplify the filename
ln -sf cloudwatch_exporter-${VERSION}-jar-with-dependencies.jar cloudwatch_exporter.jar
The final directory structure is as follows.
/opt/cloudwatch-exporter/
├── cloudwatch_exporter.jar              # Symbolic link
├── cloudwatch_exporter-0.16.0-jar-with-dependencies.jar  # Actual JAR file
└── config.yml                           # Configuration file (created in the next section)
Writing the configuration file (config.yml)
Traditional cloud monitoring enables collection via toggle buttons, but the OpenMetrics approach requires you to write a config.yml file directly to configure collection targets and metrics.
Metric documentation by major service
S3 storage metrics are daily metrics, so period_seconds must be set to 86400 (1 day).
Basic structure of config.yml
Required parameter descriptions
| Parameter | Description | Example |
|---|---|---|
region | AWS region | ap-northeast-2 |
aws_namespace | AWS service namespace | AWS/EC2, AWS/RDS |
aws_metric_name | Name of the metric to collect | CPUUtilization |
aws_dimensions | Metric classification criteria | [InstanceId] |
aws_statistics | Statistics type | [Average, Maximum, Sum] |
period_seconds | Data point interval (seconds) | 300 (5 minutes) |
range_seconds | Time range to query (seconds) | 600 (10 minutes) |
delay_seconds | CloudWatch data delay compensation (seconds) | 600 (10 minutes) |
Statistics types (aws_statistics)
| Statistic | Description | Usage example |
|---|---|---|
Average | Average value | CPU utilization, memory utilization |
Sum | Total | Network traffic, request count |
Maximum | Maximum value | Peak CPU, maximum latency |
Minimum | Minimum value | Minimum free space |
SampleCount | Number of samples | Data point count |
Recommended settings by service
| Service | period_seconds | range_seconds | delay_seconds |
|---|---|---|---|
| EC2 (basic monitoring) | 300 | 600 | 600 |
| EC2 (detailed monitoring) | 60 | 300 | 120 |
| EBS Volume | 300 | 600 | 600 |
| RDS | 60 | 300 | 120 |
| Lambda | 60 | 300 | 120 |
| ELB / ALB / NLB | 60 | 300 | 120 |
| DynamoDB | 60 | 300 | 120 |
| CloudFront | 60 | 300 | 120 |
| ElastiCache | 60 | 300 | 120 |
| S3 (request metrics) | 60 | 300 | 120 |
| S3 (storage metrics) | 86400 | 172800 | 600 |
| ECS | 60 | 300 | 120 |
| ECS/ContainerInsights | 60 | 300 | 120 |
| AutoScaling | 60 | 300 | 120 |
| ElasticBeanstalk | 60 | 300 | 120 |
Formula for determining values
period_seconds= The publishing interval of the servicerange_seconds≥period_seconds × 2(safety margin, typically 2–5×)delay_seconds≥period_seconds × 2
Exceptions / Notes
- EC2 basic monitoring: The default is 5-minute intervals. Reducing
period_secondsto 60 will not produce more data — it still publishes once every 5 minutes and only generates empty data points. - EBS Volume: Same as EC2 — 5-minute intervals.
- S3 storage metrics: Published once per day. Set
period_secondsto 86400 (1 day) and makedelay_secondssufficiently large. - Custom metrics (high resolution): 1-second resolution is possible but incurs higher costs. 60 seconds is usually sufficient.
Why CloudWatch data refers to a past point in time
- Statistics are only calculated after the aggregation window ends — A 5-minute average cannot be computed until that full window has elapsed. Querying the 10:00–10:05 average at 10:03 returns no data because the window has not yet closed.
- Query delay to avoid ingestion lag (
delay_seconds) — CloudWatch can take several minutes to reflect metrics in its API. To avoid fetching incomplete data, OpenAgent is configured to query only data older than a certain threshold. Based on current settings, data from EC2, ALB, and EBS is reliably available from approximately 10–15 minutes ago, and data from ElastiCache and ECS from approximately 1–2 minutes ago. (This varies by service depending onperiod_secondsanddelay_secondssettings.) - EC2 basic monitoring publishes on a 5-minute interval — This is the default AWS publishing frequency. Enabling detailed monitoring (paid) allows 1-minute collection.
config.yml configuration example
# config.yml example
region: ap-northeast-2               # AWS region
metrics:                             # List of metrics to collect
  - aws_namespace: AWS/EC2           # AWS service namespace
    aws_metric_name: CPUUtilization  # Metric name
    aws_dimensions: [InstanceId]     # Dimension (classification criteria)
    aws_tag_select:                  # Tag-based filtering and label addition
      resource_type_selection: "ec2:instance"  # Resource type
      resource_id_dimension: InstanceId        # Resource ID mapped to dimension
    aws_statistics: [Average]        # Statistics type
    period_seconds: 300              # Data point interval
    range_seconds: 600               # Query time range
    delay_seconds: 600               # Data delay time
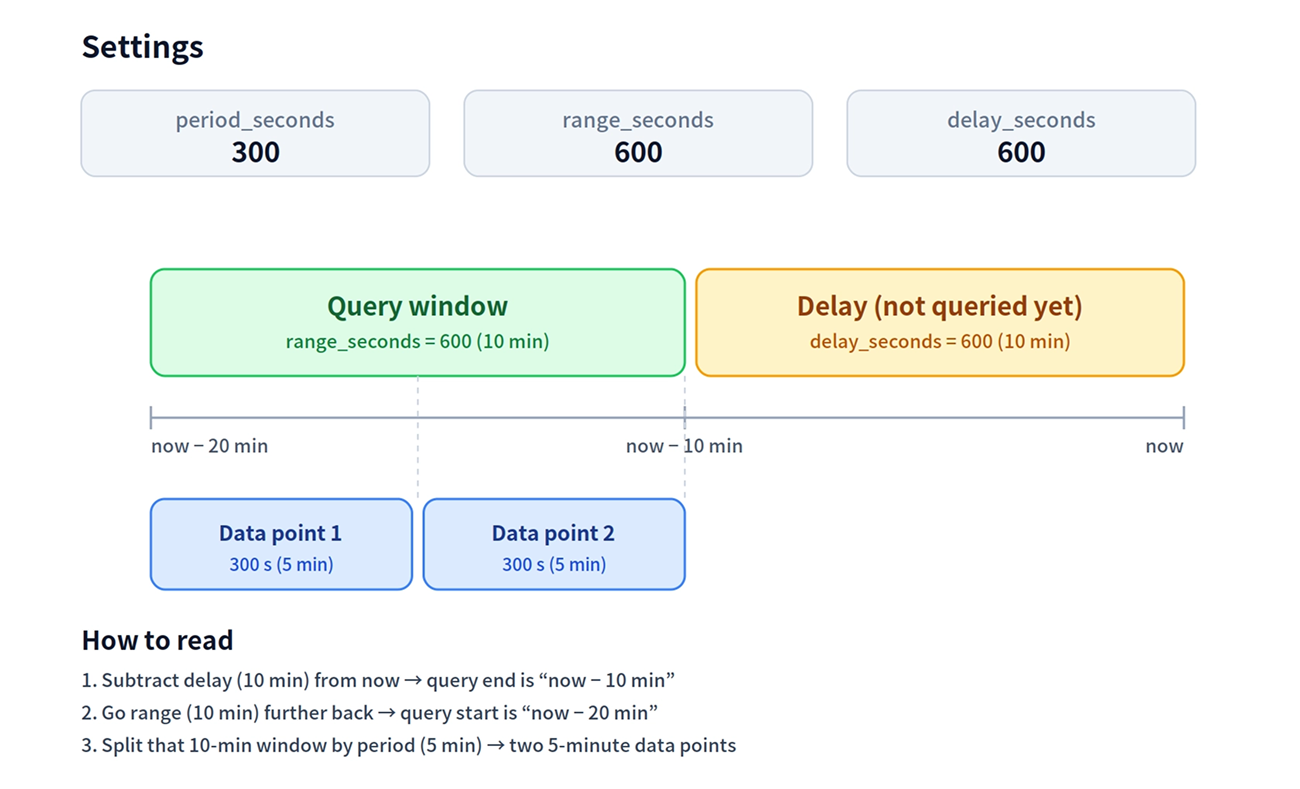
Advanced parameters: Filtering
- aws_dimension_select (collect specific resources only)
- aws_namespace: AWS/EC2
  aws_metric_name: CPUUtilization
  aws_dimensions: [InstanceId]
  aws_dimension_select:
    InstanceId:
      - i-xxxxxxxxxxxxxxxx1
      - i-xxxxxxxxxxxxxxxx2
  aws_statistics: [Average]
  period_seconds: 300
  range_seconds: 600
  delay_seconds: 600
- aws_dimension_select_regex (regex-based filtering)
- aws_namespace: AWS/EC2
  aws_metric_name: CPUUtilization
  aws_dimensions: [InstanceId]
  aws_dimension_select_regex:
    InstanceId: "^i-0123.*"
  aws_statistics: [Average]
  period_seconds: 300
  range_seconds: 600
  delay_seconds: 600
- aws_tag_select (tag-based filtering) - recommended
- aws_namespace: AWS/EC2
  aws_metric_name: CPUUtilization
  aws_dimensions: [InstanceId]
  aws_tag_select:
    tag_selections:
      Environment: ["production", "staging"]
      Team: ["devops"]
    resource_type_selection: "ec2:instance"
    resource_id_dimension: InstanceId
  aws_statistics: [Average]
  period_seconds: 300
  range_seconds: 600
  delay_seconds: 600
If a key is specified in tag_selections, resources that do not have that tag are excluded from metric collection. If metrics are missing, first verify that the target resources have the relevant tags configured.
| Service | resource_type_selection | resource_id_dimension |
|---|---|---|
| EC2 | ec2:instance | InstanceId |
| ALB | elasticloadbalancing:loadbalancer/app | LoadBalancer |
| NLB | elasticloadbalancing:loadbalancer/net | LoadBalancer |
| CLB | elasticloadbalancing:loadbalancer | LoadBalancerName |
| RDS | rds:db | DBInstanceIdentifier |
| Aurora | rds:cluster | DBClusterIdentifier |
| EBS | ec2:volume | VolumeId |
| ElastiCache | elasticache:cluster | CacheClusterId |
Run CloudWatch Exporter
Run with nohup (for quick testing)
cd /opt/cloudwatch-exporter

# Run in background
nohup java -jar cloudwatch_exporter.jar 9106 config.yml > cloudwatch_exporter.log 2>&1 &

# Check process
ps aux | grep cloudwatch_exporter

# Check logs
tail -100f cloudwatch_exporter.log

# Stop
pkill -f cloudwatch_exporter.jar
Register as a systemd service (recommended for production)
Method 1: Environment variable
sudo vi /etc/systemd/system/cloudwatch-exporter.service
[Unit]
Description=Prometheus CloudWatch Exporter
After=network-online.target

[Service]
Type=simple
WorkingDirectory=/opt/cloudwatch-exporter

# Set AWS Credentials directly as environment variables
Environment="AWS_ACCESS_KEY_ID=AKIAXXXXXXXXXXXXXXXX"
Environment="AWS_SECRET_ACCESS_KEY=xxxxxxxxxxxxxxxxxxxxxxxxxxxxxxxxxxxxxxxx"

ExecStart=/usr/bin/java -jar /opt/cloudwatch-exporter/cloudwatch_exporter.jar 9106 /opt/cloudwatch-exporter/config.yml
Restart=always
RestartSec=5

[Install]
WantedBy=multi-user.target
Method 2: AWS Credentials file
sudo vi /etc/systemd/system/cloudwatch-exporter.service
[Unit]
Description=Prometheus CloudWatch Exporter
After=network-online.target

[Service]
Type=simple
WorkingDirectory=/opt/cloudwatch-exporter

# AWS SDK references the $HOME/.aws/credentials file
# ex: uses /root/.aws/credentials
Environment="HOME=/root"

ExecStart=/usr/bin/java -jar /opt/cloudwatch-exporter/cloudwatch_exporter.jar 9106 /opt/cloudwatch-exporter/config.yml
Restart=always
RestartSec=5

[Install]
WantedBy=multi-user.target
Start the service
sudo systemctl daemon-reload
sudo systemctl start cloudwatch-exporter
sudo systemctl enable cloudwatch-exporter
sudo systemctl status cloudwatch-exporter
Download and configure OpenAgent
All files must be located in the same directory.
## Example
/opt/whatap/openagent/
├── openagent          # Executable file
├── whatap.conf        # Configuration file
└── scrape_config.yaml # Scraping configuration file
Navigate to directory and download executable
mkdir -p /opt/whatap/openagent
cd /opt/whatap/openagent

## AMD64 (Intel/AMD 64-bit processor)
wget https://repo.whatap.io/openagent/latest/amd/openagent

## ARM64 (ARM processor in Linux environment)
## CAUTION: macOS Apple Silicon not supported
wget https://repo.whatap.io/openagent/latest/arm/openagent
Set execute permission
chmod +x openagent
Create scrape_config.yaml
When the scrape_config.yaml file is modified, OpenAgent automatically detects the changes and reloads the configuration. No restart is required.
Important: The scrape interval (interval) must be set to at least the exporter's period_seconds.
interval ≥ period_seconds
CloudWatch only generates a new data point every period_seconds. However, CloudWatch Exporter calls the CloudWatch API in real time on every scrape request, so setting interval shorter than period_seconds results in the following.
-
No new data: You simply collect the same value for the same timestamp repeatedly.
-
Increased cost: The number of API calls scales with the number of scrapes. Halving the interval doubles the CloudWatch API charges.
exporter period_seconds | Recommended interval |
|---|---|
| 300 (EC2 basic monitoring, EBS, etc.) | "300s" or higher |
| 60 (RDS, ALB, EC2 detailed monitoring, etc.) | "60s" or higher |
| 86400 (S3 storage metrics) | Can be set short, but the data itself only refreshes once a day |
If config.yml mixes metrics with different periods, match the shortest period_seconds.
#scrape_config.yaml
features:
  openAgent:
    enabled: true
    targets:
      - targetName: cloudwatch-exporter
        type: StaticEndpoints
        # Target is enabled by default (enabled: true), this can be omitted
        enabled: true
        endpoints:
          - address: "192.168.49.2:9106"
            path: "/metrics"
            scheme: "http"
            interval: "300s"   # ⚠️ set to at least the exporter's period_seconds (e.g., 300)
            metricRelabelConfigs:
              - source_labels: [__name__]
                regex: ".*"
                action: keep
Run in foreground
./openagent standalone
Run in background
nohup ./openagent standalone > /dev/null 2>&1 &
Check logs
tail -f logs/whatap-boot-{yyyymmdd}.log
Process management
# Check process
ps aux | grep openagent

# Terminate process
pkill openagent
StaticEndpoints configuration elements
- targetName: Name of the target (for identification)
- type: Target type ("StaticEndpoints")
- endpoints: Definition of endpoints to scrape
address: Target address to scrape (IP:PORT or HOSTNAME:PORT)path: Metrics path (default: /metrics)scheme: Scraping protocol (http or https, default: http)interval: Scraping interval (default: 60s)metricRelabelConfigs: Metric relabeling configuration applied after scraping
Metric relabeling configuration (metricRelabelConfigs)
OpenAgent supports metric relabeling functionality similar to Prometheus's metric_relabel_configs. This feature lets you filter metrics or change labels after scraping.
Relabeling configuration elements
- source_labels: List of source labels (array)
- separator: Separator used when concatenating source label values (default:
;) - target_label: Target label (label where the result is stored)
- regex: Regular expression applied to source label values
- replacement: Replacement value (can reference regex capture groups, e.g.,
${1}) - action: Action to perform (keep, drop, replace)
Supported actions
- keep: Retain only metrics matching the regex
- drop: Remove metrics matching the regex
- replace: Replace the value of the target label with the replacement value
Examples
1. Collect all metrics
metricRelabelConfigs:
  - source_labels: [__name__]
    regex: ".*"
    action: keep
2. Keep specific metrics only
metricRelabelConfigs:
  - source_labels: [__name__]
    regex: "aws_ec2_cpuutilization_average"
    action: keep
3. Filter metrics using regex
metricRelabelConfigs:
  - source_labels: [__name__]
    regex: "aws_ec2_(cpu|network).*"
    action: keep
4. Rename a label
metricRelabelConfigs:
  - source_labels: [instance_id]
    target_label: ec2_instance_id
    replacement: "${1}"
    action: replace
5. Add a static label
metricRelabelConfigs:
  - target_label: metric_src
    replacement: "whatap-open-agent"
    action: replace