WhaTap mobile app
The following guides you to the functions available through the WhaTap mobile app. Through the app, you can see the status of user projects and receive alerts for the set events in real time.
The functions provided by the mobile app are as follows:
-
Dashboard: You can see the project list and check the project lists by organization and category, and monitor key metrics for each project.
-
Search for project: You can search for the desired project by using the project name or code.
-
Notice: You can see major notices for the WhaTap monitoring service.
-
Integrated notification: You can receive key notifications set for each project, and you can also see the list of previous notifications.
-
The mobile app supports the service.whatap.io service. The installed type service is unavailable.
-
Available product types are as follows. We will expand the scope of support through future updates.
- Application: Java, PHP, Python, Node.js, .NET, Go
- Server
- Database
- Kubernetes
- URL
- Browser
-
The mobile app does not support the project grouping feature.
Installing the app
The WhaTap mobile app supports both Android and iOS environments. You can install the app by using the following link or scanning the QR code.
| iOS | Android |
|---|---|
 iOS 12 or later |  Android 5.0 or later |
Log in
You must log in the app for the first time. In WhaTap monitoring service, enter the registration email address and password and then tap Get Started.
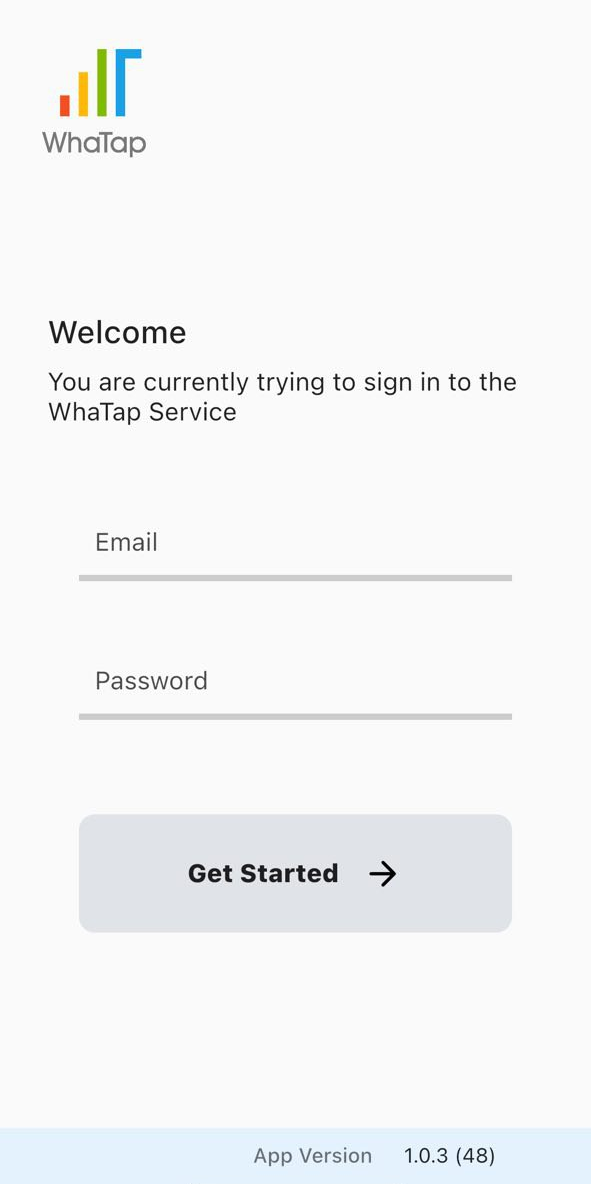
If you have no account, follow the instructions in the following for sign up. You cannot sign up for membership through the mobile app.
Guidance to the initial screen
Once you have completed logging in or running the app, you can check the Home screen. The list of projects that have set Favorites, Announcement, [Whatap's blog](https://www.whatap.io /bbs/board.php?bo_table=blog) posts can be checked.
Learn about the main features
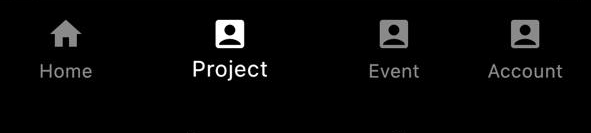
The mobile app consists of the following main menus: You can access the main functions of each menu by tapping at the bottom of the screen.
-
Project: You can see the list of projects that user belongs to or are controlled. You can see detailed information of each project and its major metrics. You can also filter the desired projects through search.
-
Event: You can see notifications for the events set in individual projects starting with the most recent data.
-
Account: You can see user accounts, change the language and notification reception, and set the OTP authentication feature.
Checking the notices
To check the notices from the WhaTap monitoring service, tap Home at the bottom of the screen. You can see key information related to the service updates.
Projects
At the bottom of the screen, tap Project. It provides the following key features.
-
You can see the list of projects that user belongs to or are controlled.
-
You can see detailed information of each project and its major metrics.
-
You can sort the projects by organization and filter the desired projects through a search.
-
You can view and filter projects by product category.
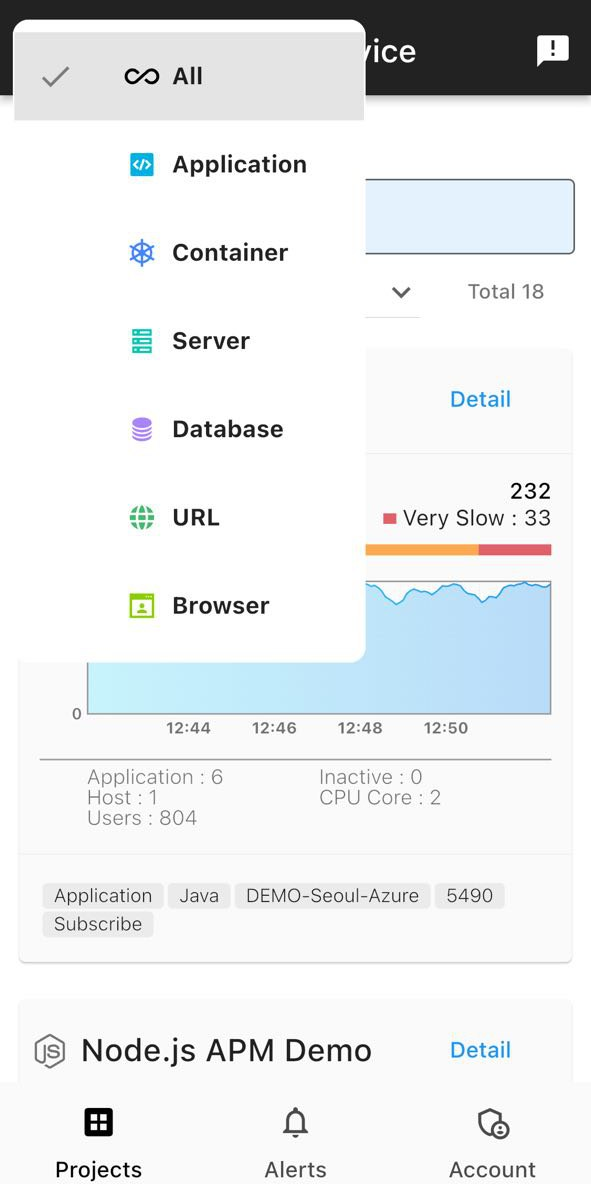
The product types that can be found in the project list are Application, Server, Database, Kubernetes, URL, and Browser.
Checking by product type
You can see the projects by product type. Select a desired product type under the Search field on the Project screen. Only the projects corresponding to the selected product type appear in the list.
Searching for the project
If it is difficult to find a project because there are a lot of projects, you can find a desired project through a search. Enter the project name or project code in the Search field, and then tap Complete on the keyboard.
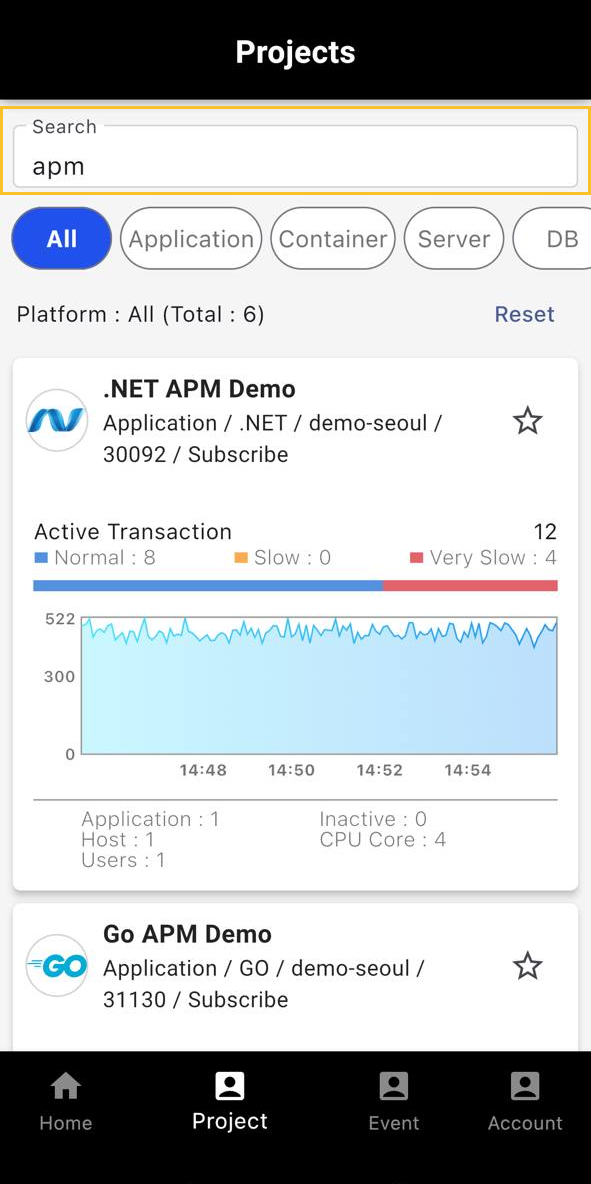
To reset your searches, tap Reset.
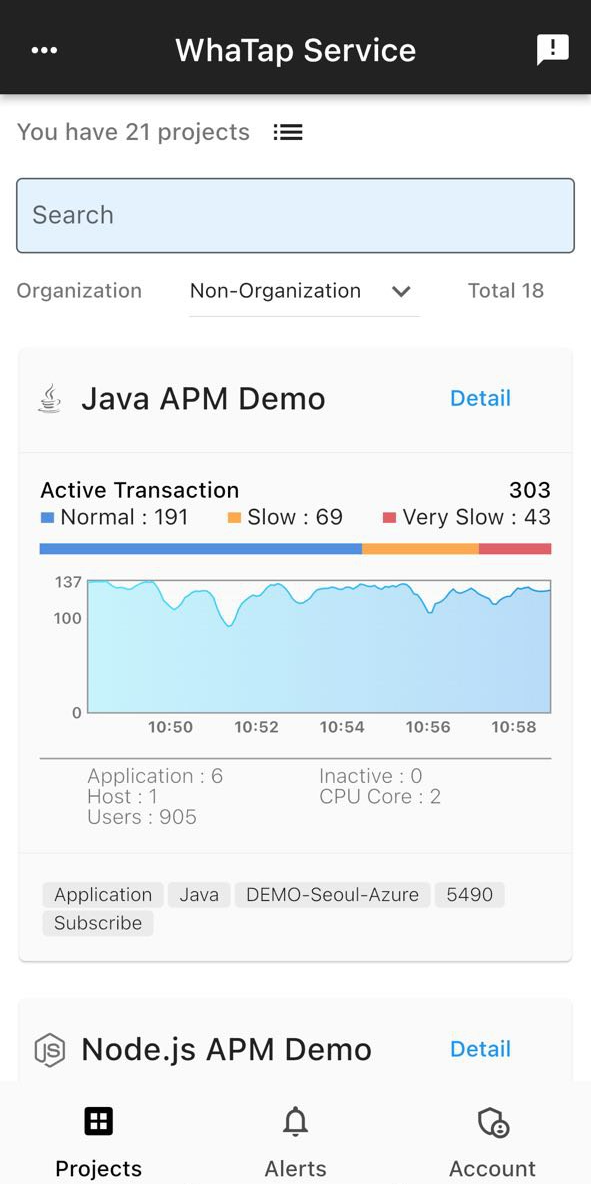
Checking the project list
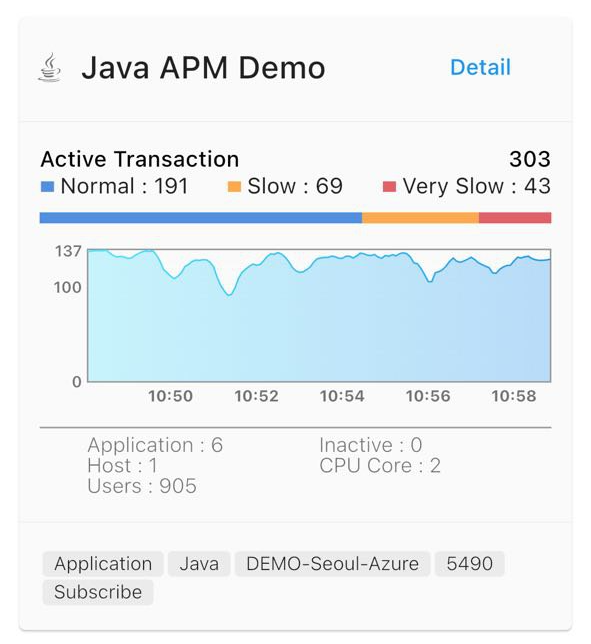
A project appears in the card view format as shown below, and it consists of the project's key metrics, basic information, and such.
-
The project name appears at the top of the project. Tap the project card to see more metrics.
-
Under the project name, the information such as product type, product name, region, project code, and subscription type appear.
-
If the
 button is selected on the right of the project name, it is displayed in the Favorites list on the Home screen.
 -
The representative metrics appear in the middle section of the project. The displayed metrics may differ depending on the product type.
-
Application: Active Transaction
-
Server: CPU utilization
-
Database: Active session
-
Kubernetes: Summary information of the Kubernetes elements
-
URL: Displays the total number of URLs and the numbers of normal URLs and erroneous URLs
-
Browser: Page load Timeline
-
Exploring the dashboard
You can go to Dashboard by tapping an individual project in the project list.
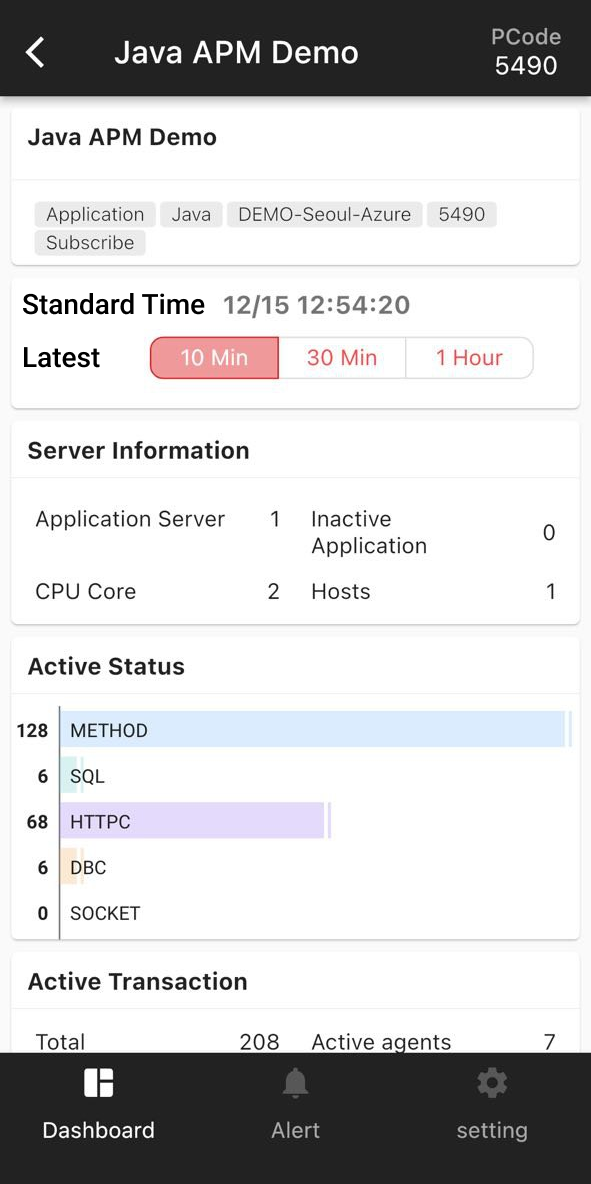
Based on the time displayed in Standard Time, the metrics can be viewed for 10 minutes, 30 minutes, and 1 hour. In Latest, tap any of 10 Min, 30 Min, and 1 Hour.
Key metrics for each product are arranged. You can check them in the following list. Server Information: Basic information about the application server appears. Active Transaction: This chart allows you to check active transactions by agent. The colors in the chart indicate the response times of active transactions. Blue (Normal) indicates within 3 seconds, Orange (Slow) 3 to 8 seconds, Red (Very slow) more than 8 seconds. Active Status: This chart allows you to see the progress of active transactions and the number of active transactions for each status. Hitmap: This chart displays the distribution of response times for completed transactions. If you tap TX trace, the Transaction List screen appears to see the transaction list. You can basically check the list of transactions where errors occurred. To check the list of all transactions, tap All. Realtime User: A chart that displays the number of real-time users aggregated based on the IP of the user's browser. Apdex: Application Performance Index (Apdex) is the indicator of the application performance. You can measure the customer satisfaction about your web applications. It can be used as an indicator of user satisfaction and the value is between 0 and 1. TPS: Number of transactions processed per second Average Res. time: Average time needed for the application server to return the request results. System CPU: It is the CPU usage of the application server. OS Information: The operating system status of the server connected to the project can be checked. Server Status: Server resource-related information can be checked. CPU Resource Map: This distribution chart displays the CPU usage of all servers. CPU Top 5: List of top 5 processes based on the maximum usage of CPU. Memory Top 5: List of top 5 processes based on the maximum usage of memory. Disk Top 5: List of top 5 processes based on the highest disk I/O usage. DB Instance List: The list and number of instances (agents) connected to the project can be checked. Thread Running Top 10: Number of top 10 sessions performing queries by instance. Thread Connected Top 10: Number of top 10 connected sessions by instance. Active Sessions: Time series chart that displays the number of active sessions performing queries during search. Thread Connected Chart: Time series chart that displays the number of connected sessions by agent during search. For Database products, you can see the detailed information and metrics for each instance by tapping List at the bottom of the screen. Number of containers: The numbers of containers for each status appear. Number of pods: The numbers of Pods for each status appear. Pod Count Chart: Time series chart that displays the number of active Pods by status during search. Node CPU: Time series chart that displays the CPU utilizations for each node during search. Node Memory: Time series chart that displays the memory utilizations for each node during search. For Kubernetes products, you can see the containers by tapping List at the bottom of the screen. You can see the details for each container. You can see the list of URLs registered by the user and the HTTP status codes for each URL. Page Load Timeline: This chart displays average times for each page load and each load step. Pageload Hitmap: This chart displays the distribution of response times for page load during search. AJAX Hitmap: This chart displays the distribution of AJAX response times during search. Number of errors per page: Displays the number of errors that occurred during search and the top N errors occurred by page. Number of errors per message: Displays the top N counts for the numbers of errors that occurred during search and the sums for each error message.Appication
Server
Database
Kubernetes
URL
Browser
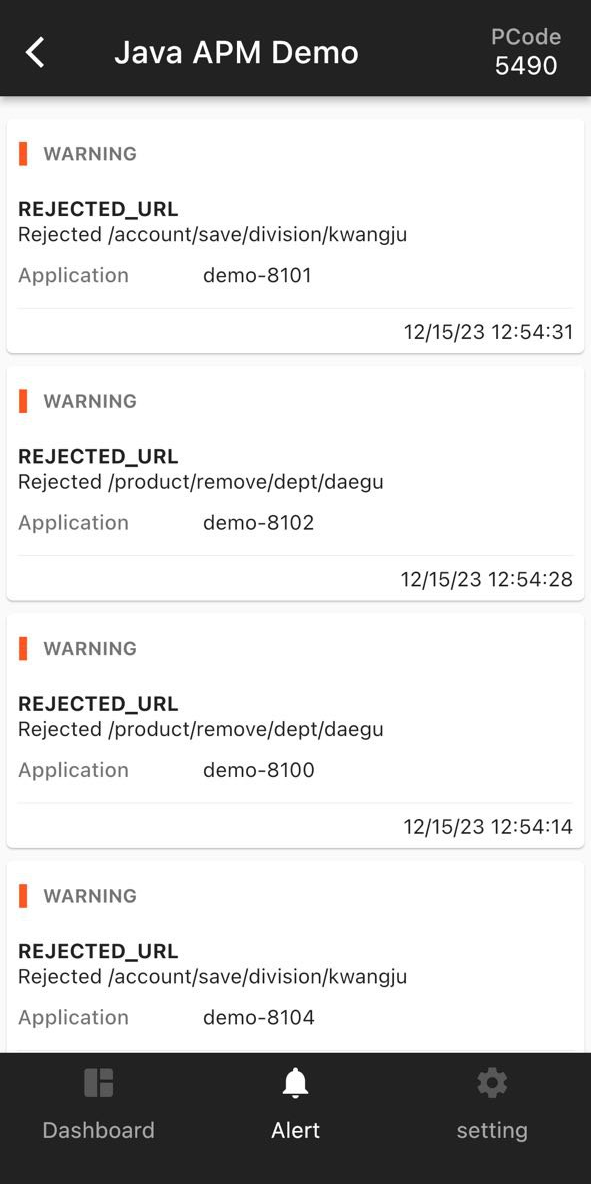
Checking alerts by project
You can see the notifications delivered to the events set in individual projects. At the bottom of the screen, tap Event.
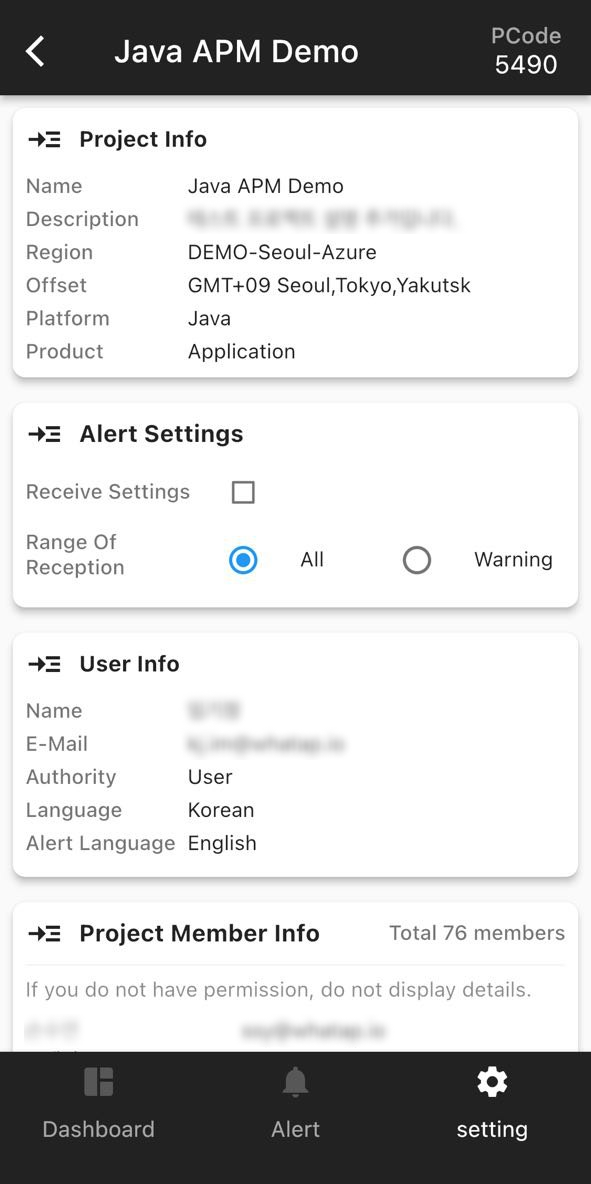
Checking the project settings
You can see the details of individual projects, alert settings, and user information. At the bottom of the screen, tap setting.
-
Project Info: You can see the detailed information of a project.
-
Alert Settings: You can set the alerts for the current project.
-
Receive Settings: You can set whether or not to receive alerts set in the current project.
-
Range Of Reception: You can determine whether to receive Total alerts or receive Warning alerts.
-
-
User Info: You can see the information of the current user.
-
Project Member Info: You can see the all users in the project.
Integrated alerts
To see the alerts for all projects, tap Event in the initial screen of the mobile app.

-
You can see alerts for all projects starting with the most recent data.
-
Tap the project name in each alert to go to the corresponding project.
You can view the alert history for up to 7 days. We will expand the scope of view through future updates.
Setting an account
Tap Account at the bottom of the mobile app's initial screen.
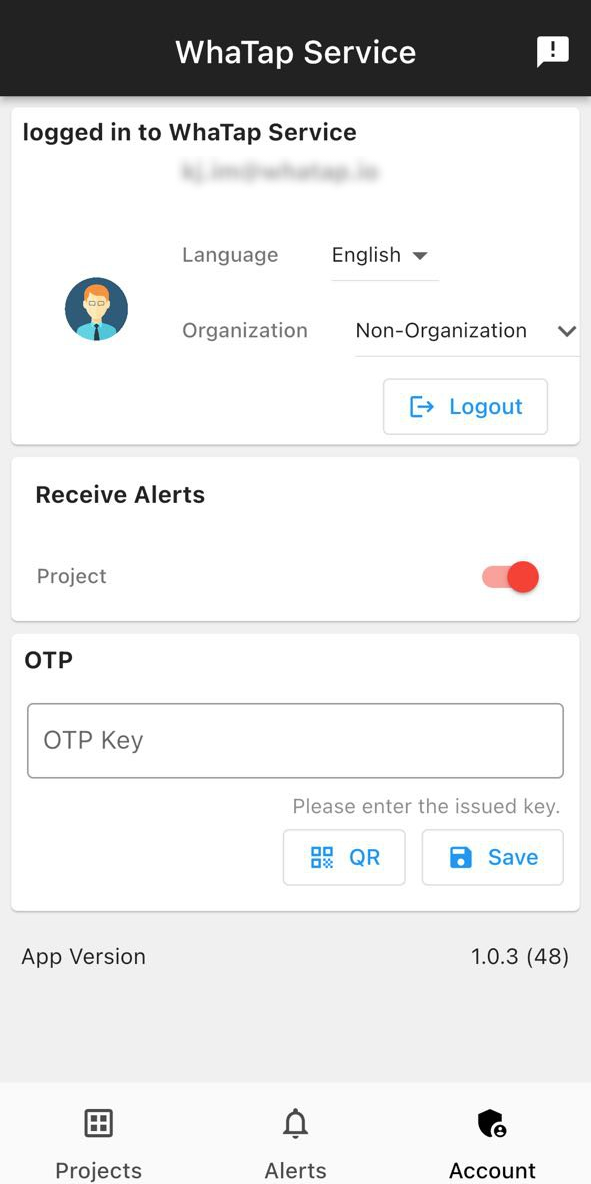
The features provided from Account are as follows:
-
Checking the user account information and configuring the language and organization settings
-
Alert Notification Setting
-
OTP authentication
Changing the app's default language
To change the default language of the mobile app, tap the favorite language in Language.
Setting the default organization
You can default the list of projects displayed in Projects as the list of projects corresponding to your organization. Select a favorite organization in Organization. The number of projects in Project changes depending on the selected organization.
Setting the alert reception
You can receive alerts or release the reception setting through the mobile app. In the Receive Alerts section, tap to apply the desired settings.
To test the reception of alerts, tap Request to send a test alarm.
OTP authentication
OTP authentication can be set through the WhaTap mobile app and the OTP authentication key can be provided to be entered when logging in the web service.
-
Log in the WhaTap monitoring service (https://service.whatap.io).
-
Select the profile icon on the upper right of the screen.
-
If the dropdown menu appears, select Manage Accounts.
-
If the My profile menu appears, scroll down the page to go to the Multi-factor authentication section.
-
If (Re)Create OTP key is selected, the QR code appears.
-
Tap Account at the bottom of the WhaTap mobile app's screen.
-
In the OTP section, tap QR.
-
Once the camera has run, scan the QR code on the web page.
-
The OTP key appears on the WhaTap mobile app.
-
Enter the OTP key on the web page and then select Validate OTP key.
The OPT authentication process is completed. Afterwards, log in WhaTap monitoring service and then enter the OTP key on the mobile app when the OTP authentication key prompts.
For more information about the multi-factor authentication, see the following.