Metrics
Home > Select Project > Metrics
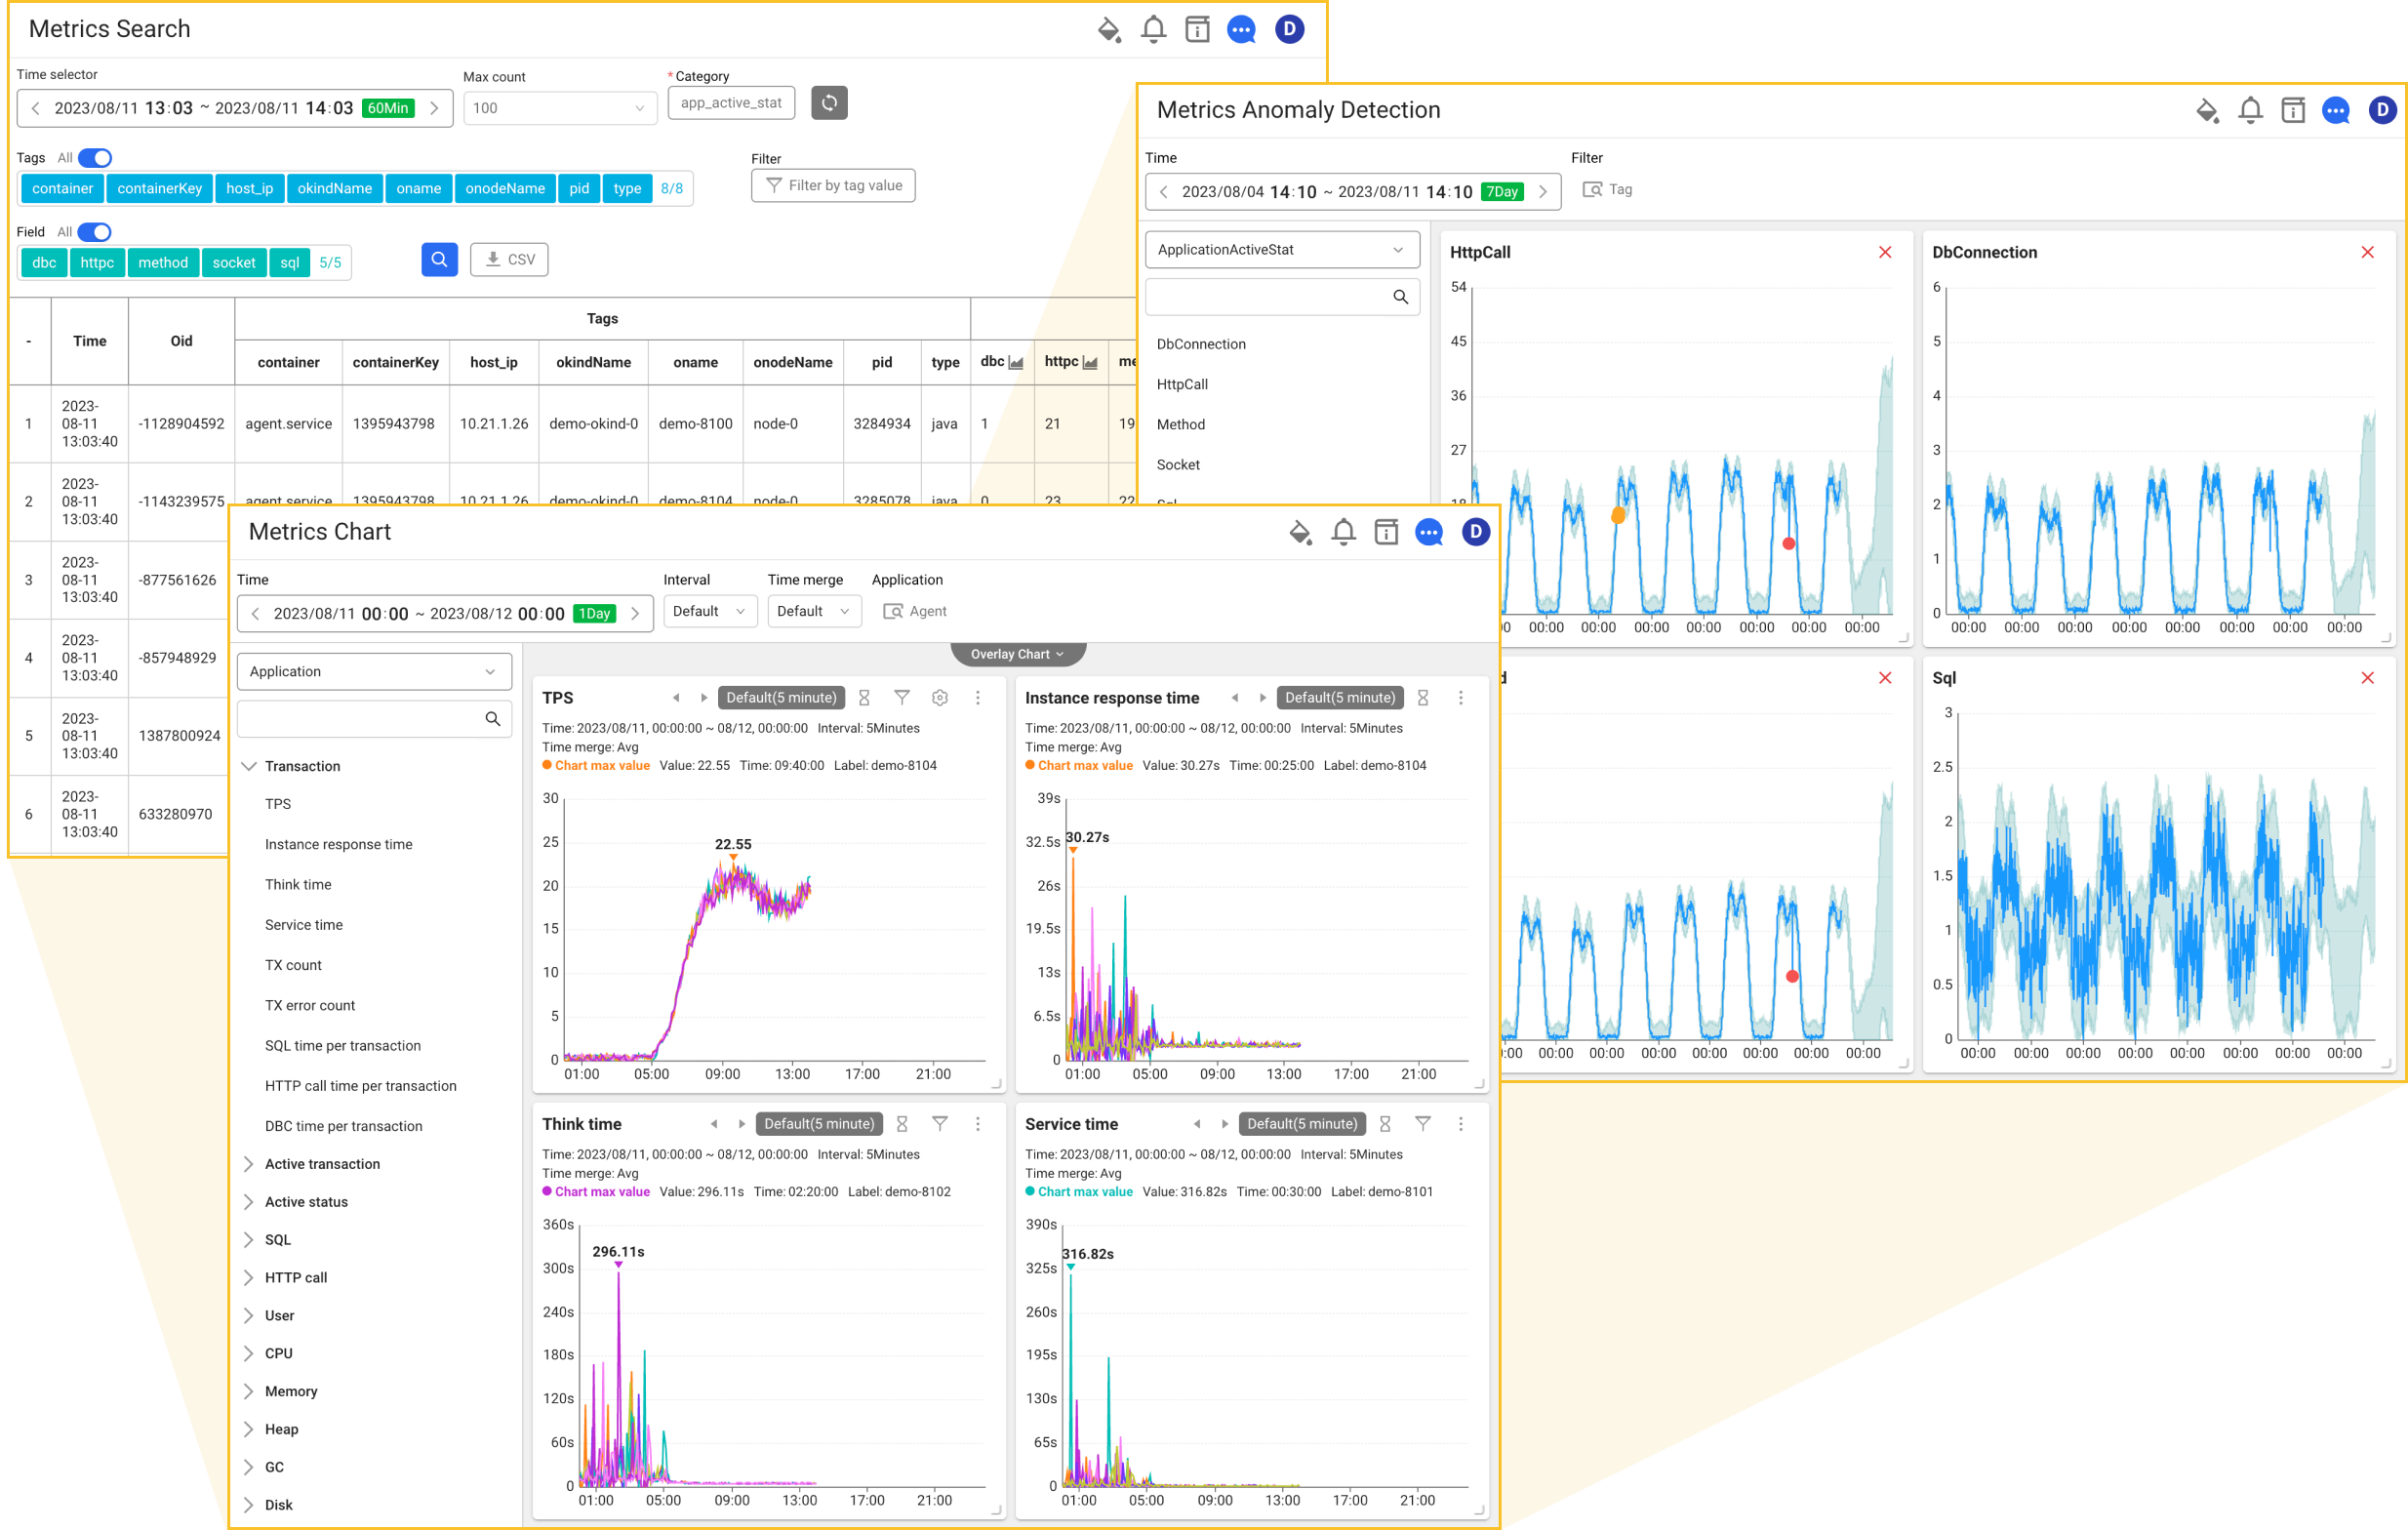
Select a project in the initial screen of the WhaTap monitoring service, and then select Metrics under Project Menu. Metrics have the time-series data that represents the performance for the monitoring target. Metrics data is collected when you create a project and install the related items. After data collection, you can use the integrated analysis function through the functions under Metrics.
-
Metrics Cube
You can analyze the trend of metric field data for each category.
-
Metrics Chart
You can see the metrics data collected from the monitoring targets as a chart.
-
Metric Anomaly Detection
You can check the patterns of various metrics and then use them to predict future metrics values.
-
Namespaces are collected under the WhaTap metrics category. The notation format changes the Amazon CloudWatch namespace to lowercase and then changes "/" to "_."
e.g. AWS/EC2 → aws_ec2
-
Metrics are collected as the WhaTap metrics. The notation format is "CloudWatchMetric.Stat."
e.g. CPUUtilization.Average
-
For collected Amazon CloudWatch metrics, see the following.
What is a metric?
A metric is time-series data that represents the state of a monitoring target as numerical values. It is the result of processing performance data collected by the WhaTap agent from monitoring targets.
Through metrics, you can view key performance indicators such as memory usage per server and DB connection time at a glance. After identifying a problem, you can perform detailed analysis through logs and traces.
Resource usage statistics help you estimate the required amount of resources, which can also be used for cost optimization.
How WhaTap collects metrics
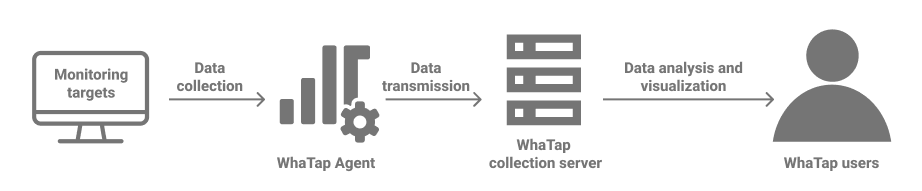
To collect metrics, install the WhaTap agent on the monitoring target. Metrics sent by the agent are stored on the WhaTap collection server.
To monitor Amazon CloudWatch, API integration setup is required. See AWS CloudWatch metrics for available metrics.
Metric components
WhaTap metrics consist of the following components:
- Category: A name that groups related metrics.
- Tags: Labels that identify collection targets. Stores rarely-changing unique information such as IP, Oname, and Host. A metric can contain multiple tags.
- Fields: Stores actual measured values. A metric can contain multiple fields.
- Time: The time when the metric was collected.
- Oid: The unique number of the agent that collected the metric.
- Oname: The name of the agent that collected the metric.
Viewing and visualizing metrics
WhaTap provides menus to view collected metrics in various ways.
- Metrics Search: View the original metric data.
- Metrics Chart: View metric data through visualized charts.
- Metrics Anomaly Detection: Detect anomalies by comparing with metric patterns learned by AI.