Dashboard by item
Select a project in the initial screen of the WhaTap monitoring service, and then enter dashboards for each item under Project Menu.
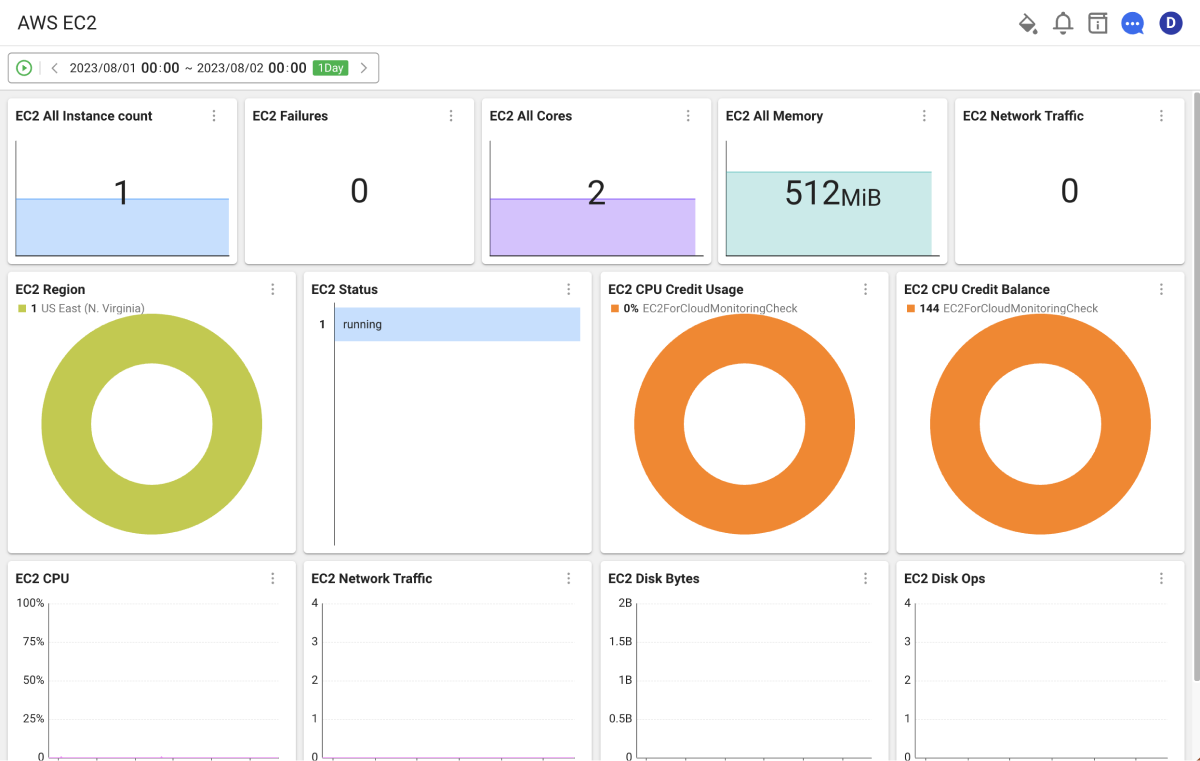
Amazon CloudWatch
-
EC2, EBS, ELB, AutoScaling, ElasticBeanstalk, and ElastiCache service dashboards are provided.
-
Namespaces are collected under the WhaTap metrics category. The notation format changes the Amazon CloudWatch namespace to lowercase and then changes "/" to "_."
e.g. AWS/EC2 → aws_ec2
-
Metrics are collected as the WhaTap metrics. The notation format is "CloudWatchMetric.Stat."
e.g. CPUUtilization.Average
Note
- For collected Amazon CloudWatch metrics, see the following.
- In addition to the template dashboard provided by WhaTap, create a custom integrated dashboard, Flex board.