Monitoring Multiple Instances
Home > Select Project > Dashboard > Monitoring Multiple Instances
While you can monitor only one agent (instance) in Monitoring a Database Instance, Monitoring Multiple Instances allows you to monitor and manage multiple agents (instances).
You can compare and analyze key performance metrics occurring in each instance at a glance. You can effectively perform monitoring by aggregating data such as the number of agents running, the sum of all active sessions, and the number of transactions. Users can easily check the changes in metric values over time and high performance metrics for each instance through graph charts.
Additionally, users can see the longest-lasting active sessions, which can be used as a basis for diagnosing and resolving the system performance bottlenecks.

If you select an agent to compare in Dashboard > Instance List, and then select Multi view, the Monitoring Multiple Instances menu appears.
Query Time Setting
The dashboard basically provides the real-time monitoring feature but the past data can be viewed using the time selector at the top of the screen. In the time selector, select  and then set the following time. It updates the data in widgets placed on the dashboard based on the set time.
Agent Check
Checking the agent connection status

On the upper left of the screen, the right area of the time selector provides information that allows you to check the status of agents connected to the project. This allows you to immediately check whether the target application server is running.
-
Total: Number of all agents connected to the project
-
Active: Number of active agents
-
Inactive: Number of inactive agents
-
 : Can display or hide inactive agents.
Agent-based monitoring

By default, the dashboard displays the metrics collected from all agents in charts and you can also view the data by agent. Select one or more agents under the time selector. The data of the widgets on the dashboard is updated with the metrics of the selected agent(s).
To select all agents again while one or more agents is selected, deselect them or click Total.
If there are numerous agents connected to the project, it is efficient to set the agent names to be short. For more information about the agent name setting, see the following.
Widget Edit
The widgets on the dashboard can be adjusted to the desired size and placed in the desired positions. You can also delete unnecessary widgets or add them again.
Resizing a widget
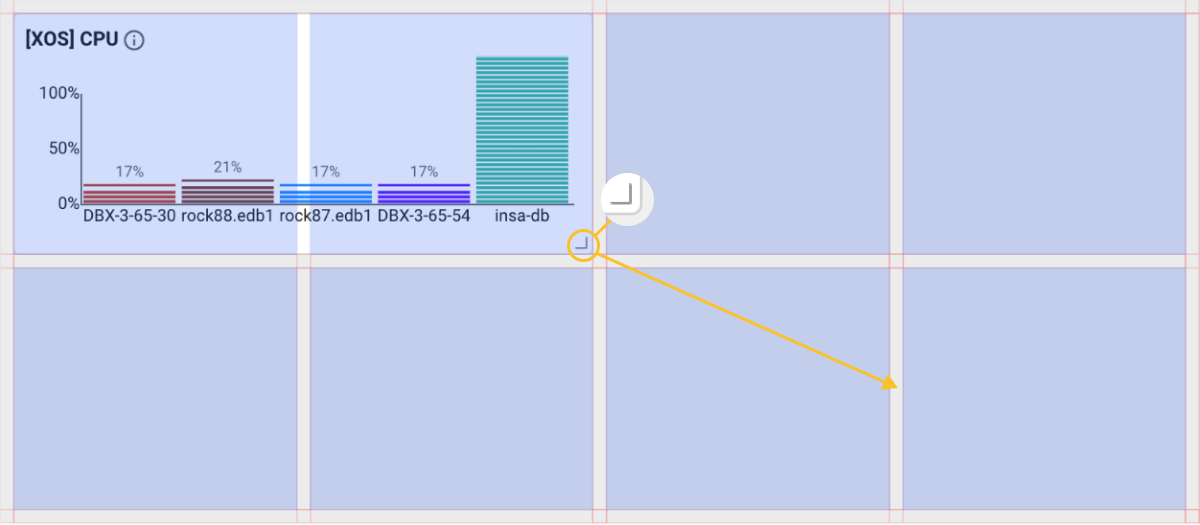
Click and hold the mouse on the  element at the lower right of the widget, and then drag it to the desired size. Grids with a uniform horizontal-to-vertical ratio appear and the size of the widget can be adjusted in each grid.
Moving a widget
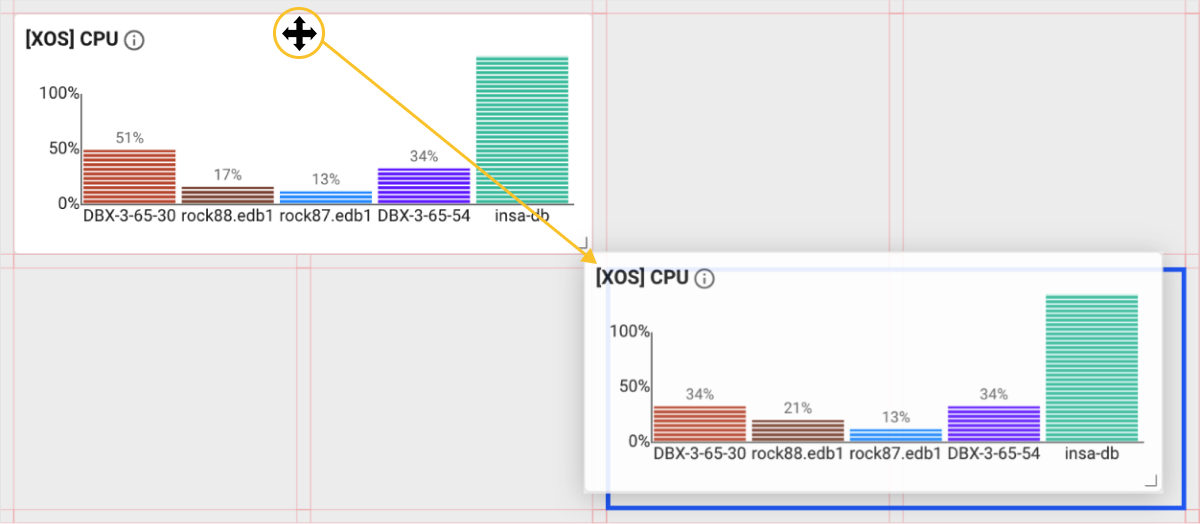
When you move the mouse cursor to the top of the widget, the cursor shape changes to  . At this time, you can move the widget by dragging with your left mouse button and move to the desired position.
Deleting a widget
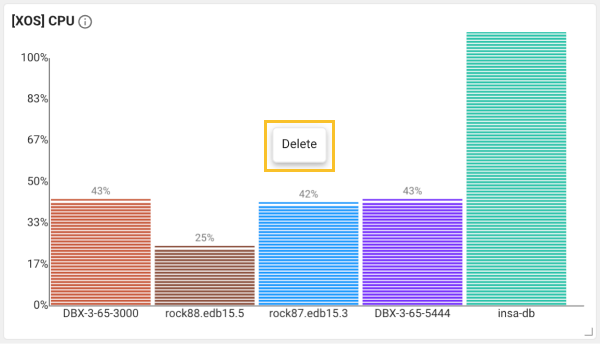
Right-click on a widget to delete. If you select Delete, the widget is deleted from the dashboard.
Adding a widget
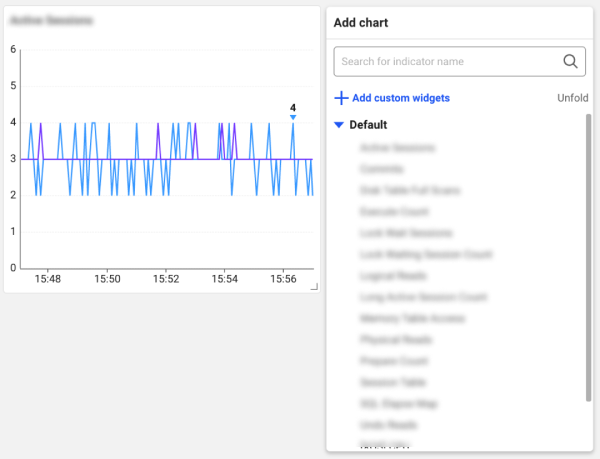
Move the mouse cursor to an empty space on the dashboard and then right-click on it. Select a widget to add from the pop-up menu. Place the widget to the desired position and then resize it.
-
For more information about the widgets that can be placed on the dashboard, see the following.
-
In addition to the metrics provided by default on the dashboard, you can add the desired metrics. For more information about custom widgets, see the following.
Custom widget
The custom widget feature allows users to add their own metrics in addition to the metrics provided by default on the dashboard. If you have metrics to continuously monitor on the dashboard in addition to the metrics provided by default, use the custom widget feature.
Add
-
Right-click an empty space on the dashboard.
-
On the pop-up menu, select Add Custom Widgets.
-
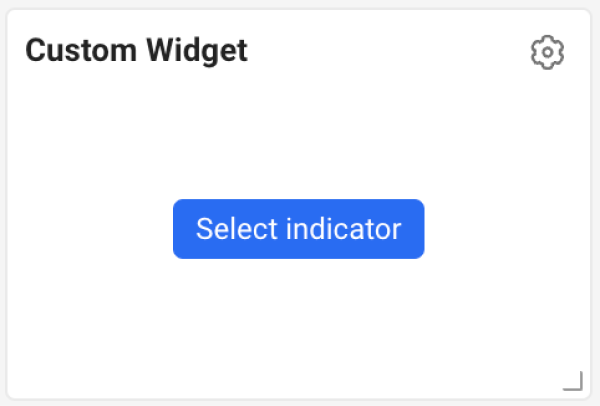
If Custom Widget is created on the dashboard, select Select indicator.
-
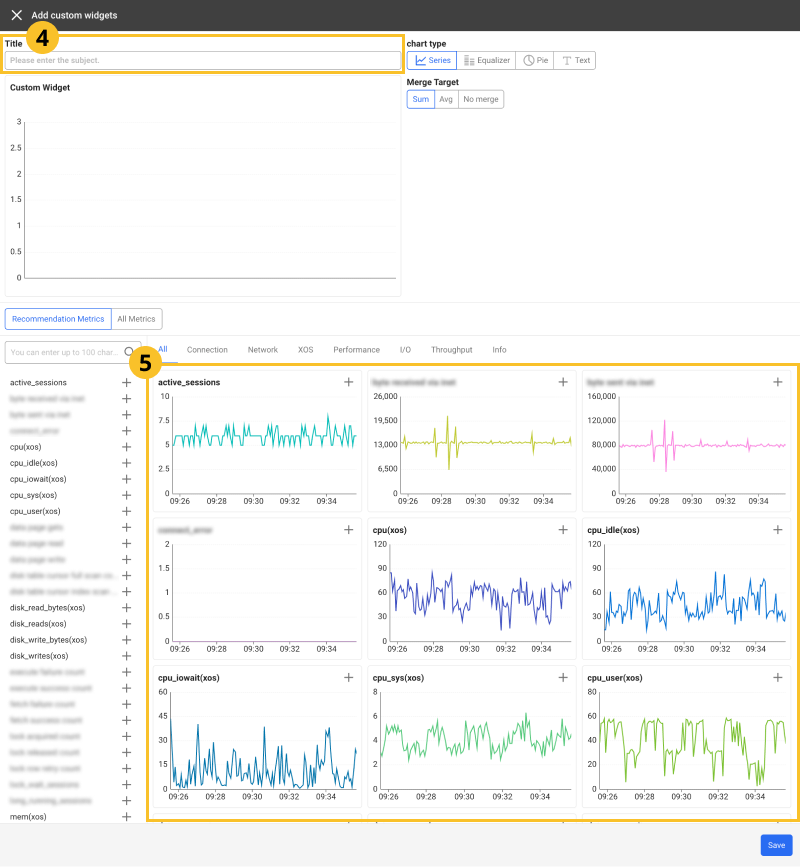
When the Add Custom Widgets window appears on the right of the screen, enter the widget name in Title.
-
In the metrics list at the bottom of the screen, select the
 button on the upper right of the metric to add.
 -
After the metric has been changed, select Save.
-
You can add up to four metrics. To add metrics, select
. -
Ti change the metric, select a different metric in the metrics list. If you select
, the metric is added. -
If you do not enter the widget title, it is saved as a custom widget.
Selecting the chart type
In chart type of the Add Custom Widgets window, you can select the following types.
-
 Series: Time series chart that displays the metric changes over time.
 -
 Equalizer: Bar graph chart that can compare the performance for multiple metrics. By visually displaying various metrics on one screen, you can easily see the overall performance status.
 -
 Pie: Pie chart useful for checking the composition ratio for multiple metrics relative to the whole.
 -
 Text: It displays the figures for the metrics in text.
Selecting the data merging method
In Merge target of the Add Custom Widgets window, you can select the way to display metrics collected from agents.
-
Sum: It sums up the metric values collected from multiple agents and displays them as a single value. This option is useful for displaying the overall total by merging data from multiple agents.
-
Avg: It averages the metric values collected from multiple agents and displays them as a single value. This option is useful for checking the average performance or status of all agents.
-
Max: By selecting the largest value among the metric values collected from multiple agents, it displays a single value. This option is useful for identifying the highest performance consumption or worst performance cases among agents.
-
No Merge: It displays the metrics for each agent.
The available merge method may differ depending on the chart type.
Changing a metric
You can change or add metrics for the metrics added to the custom widget.
-
Select
 on the upper right of the custom widget added on the dashboard.
 -
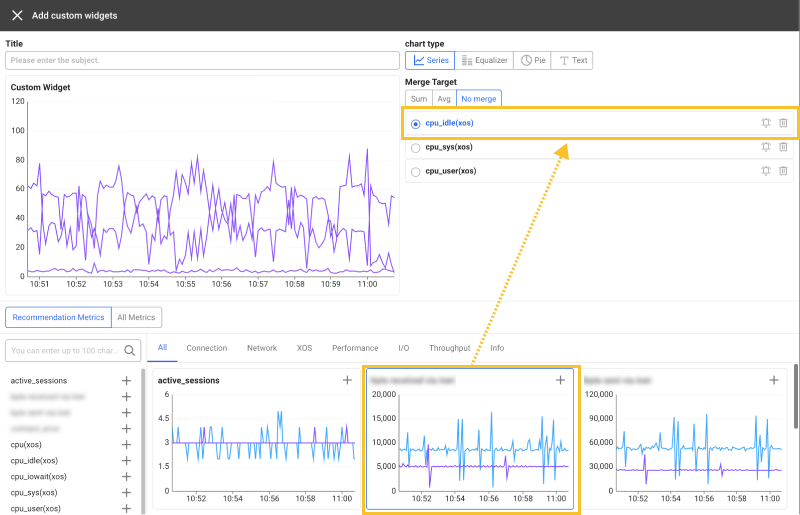
When the Add Custom Widgets window appears on the right of the screen, select a metric to change.
-
Select a metric to change from the metric list at the bottom of the screen. To add a metric, select
on the upper right of the metric to add. -
After the metric has been changed, select Save.
The features of the icon buttons in the list for added or changed metrics are as follows:
-
 : You can exclude the metric from the custom widget.
 -
 : You can set the alert for the metric. When the button is selected, the Alert > Event Configuration appears. For more information about the Metrics event setting, see the following.
Widget Options
The icons displayed on the widget function as follows:
The provided options may differ depending on the widget.
Preset Setting
You can save and load the settings and layouts for widgets on the dashboard. You can create a new preset by adjusting its size and placing it on the desired position.

-
The dashboard settings that can be stored into a preset are as follows:
-
Widget size and location
-
Settings defined in the custom widget
-
Width, filter, and selected column values of the table defined in the Session Table widget.
-
-
The default preset (Default) cannot be changed.
-
Depending on the database environment, some presets may not be supported.
-
You can save or modify the presets with the Edit project role. For more information about the member roles, see the following.
Creating a new preset
-
Place the widgets in the desired format on the dashboard. You can also resize and place only the widgets to be frequently checked.
-
On the upper right of the screen, select
 .
. -
Enter a new preset name.
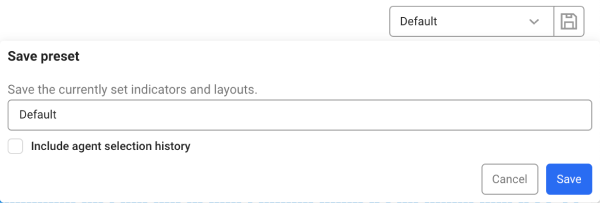
To save the selected agent data, select Include agent selection history.
-
Select Save.
You can see the newly saved preset from the preset list.
-
If any changes are made to the newly created preset, save the preset again. Select
and then save the preset with the same name. Any changes are overwritten in the existing preset. -
If you go to another menu without saving changes on the dashboard, the changes are not saved.
-
Presets are saved on a project basis and can be shared with other users.
Deleting presets
If you have unused presets, you can delete them from the preset list. Select  on the right of the item to delete from the preset list.
The Default preset cannot be deleted.
Learning about the main widgets
The types of widgets that can be placed on the dashboard are as follows.
Database widgets
The provided widgets allow you to check the status of various system resources, such as CPU, memory, and disk I/O, as key metrics for database performance analysis.
-
CPU (
cpu_usage_total)You can see the CPU utilization (%) for each instance. This value is calculated using the CPU metric in the
SYSIBMADM.ENV_SYS_RESOURCEmanagement view's metadata. -
Memory (
mem)You can see the memory utilization (%) for each instance. This value is calculated using the memory metric in the
SYSIBMADM.ENV_SYS_RESOURCEmanagement view's metadata.
-
Active Sessions
It visually displays the numbers of active sessions over time in a time series chart. This widget traces and graphs the numbers of sessions running in the database over time. It is useful for visually checking the session usage patterns and load.
-
Lock Wait Sessions
It visually displays the numbers of lock waiting sessions over time in a time series chart. This widget traces the numbers of sessions in lock waiting state in the database over time and displays it on the graph in real time.
-
Long Active Session Count
It provides information about active sessions running on the database for long time. A chart appears for information aggregated by time zone with grouped by the session execution time. It can identify long-running sessions with performance issues or resource leaks in the database, or classify the sessions based on the execution time to visually display which sessions stay active for long time.
It appears in blue for less than 3 seconds, green for 3 seconds or more that is less than 10, orange for 10 seconds or more that is less than 15, and red for 15 seconds or more.
-
Long Waiting Session Count
It provides information about the long-term latency of the sessions holding or waiting for locks in the database. By combining lock information and active session information, you can trace long-term latencies for queued sessions. It monitors the sessions that are holding locks or waiting for long time. You can visually see which sessions are holding locks or waiting for long time.
It appears in blue for less than 5 seconds, green for 5 seconds or more that is less than 10, orange for 10 seconds or more that is less than 60, and red for 60 seconds or more.
-
SQL Elapse Map
Displays a real-time chart for the elapsed times of running queries. If you drag a specific part of the chart, the Query List appears. You can enlarge or reduce the range of the vertical axis by selecting
 or
or  .Note
.NoteThe execution times of queries are calculated after collecting active sessions. Therefore, depending on the active session collection cycle, there may be a margin of error. See the following figure. The execution times of SQL queries that have ended within the collection cycle are not calculated. A shorter collection cycle may decrease the margin of error, but considering the database load, it is typically set to 5 seconds. It is useful for monitoring long-running queries. The same is true for the data in SQL statistics.

-
Index Physical Reads (
index_physical_reads)It is the number of index pages read from disk in the database. This important metric evaluates the disk I/O performance. A higher value indicates increase in disk operation. It is used to identify disk I/O bottlenecks or analyze the index efficiency.
-
Logical I/O (
data_logical_reads)It is the total number of pages read from the buffer pool in the database. It is the metric of the caching operations in memory of the system. A high value may indicate that the buffer pool is operating efficiently. By comparing logical reads and physical reads, the efficiency of the buffer pool can be analyzed.
-
Physical I/O (
data_physical_reads)It is the total number of pages read from disk in the database. This metric displays physical I/O operations and may increase if the buffer pool is unable to cache data. You can identify disk I/O bottlenecks and tune them to reduce physical disk accesses.
-
Data Hit Ratio(%) (
data_hit_ratio)It is the ratio of logical reads to physical reads, indicating the proportion of data cached in the buffer pool. A high value indicates that most data read operations are being processed in memory. It is used when analyzing the buffer pool size and policy for optimization of the database performance.
-
Index Hit Ratio(%) (
index_hit_ratio)It is the ratio of logical index reads to physical index reads. A high value indicates that the index is being processed efficiently in memory.
-
Total Hit Ratio(%) (
total_hit_ratio)It is the ratio of logical reads to physical reads for all data and index reads. It is a key metric for evaluating the caching efficiency of the entire database. It can be used to analyze the overall caching performance of the database operating environment and to prioritize tuning.
Session Table widget
-
Active sessions
You can view active sessions and queries. If you select an item in the rightmost query column in the table, the SQL details window appears. You can see the full text and plan information for the selected query. For more information, see the following.
-
Lock tree
You can see the lock session information, and holder and waiter information in real time. For more information about the table columns, see the following.
In the table list, the text colors are changed black → orange → Red, which means that the performance of the session is getting slower.
View SQL Details
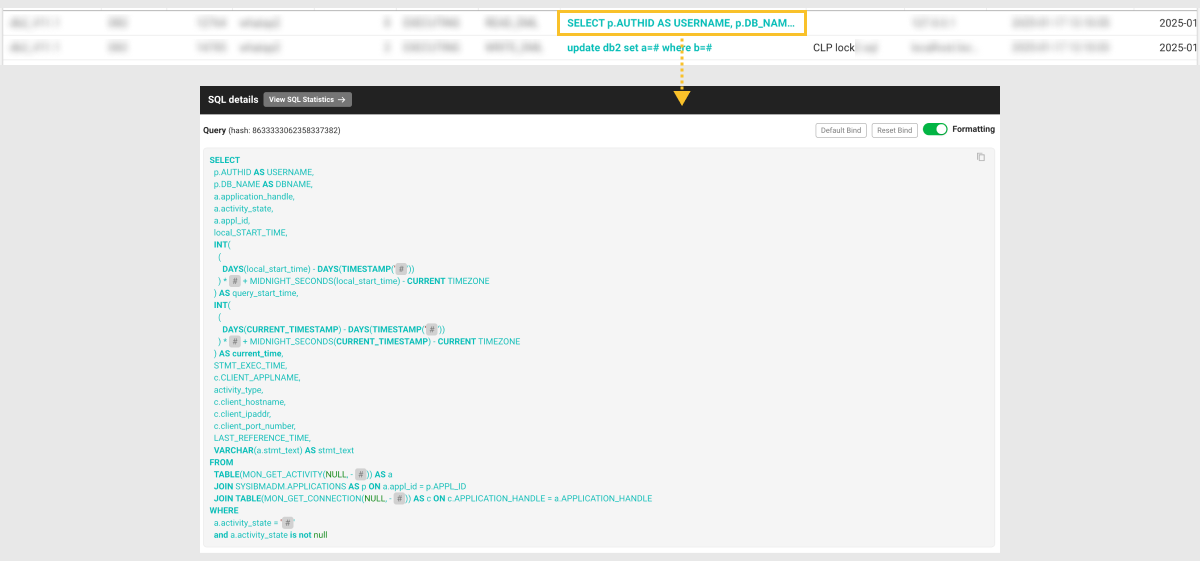
To check the SQL query information of the executing session, select the query (or sql_text) column in the Active sessions section. The SQL details window appears. You can check the SQL query statements and plan information.
Click the View SQL Statistics → button to move to SQL statistics,
where you can view statistical information related to the selected SQL query.
Column information guide
- Active session
- Lock tree
- Process information
| Item | Description |
|---|---|
instance | Name of the DB2 instance (agent). |
dbname | Database name. |
application_handle | Unique handle value that identifies a specific application. |
username | User name of the current session. |
state | Current state of the session. |
activity_type | Type of the operation running in the session. |
query | Content of the SQL query running in the session. |
application_id | Unique ID for the application used to distinguish sessions. |
application_name | Name of the application the session is running in. |
client_hostname | Hostname or IP address of the client that initiated the session. |
last_reference_time | Time when a final action was executed in the session. |
local_start_time | Local time when the session was initialized. |
query_hash | Unique hash value for the query being executed to identify the query content. |
runtime | Time when the current session was run. |
time | Total time the session was spent for tasks. |
WhaTap basically stores the client-related information.
| Item | Description |
|---|---|
instance | Name of the DB2 instance (agent). |
application_handle | Unique handle value that identifies a specific application. |
dbname | Database name. |
username | User name of the current session. |
runtime | Time when the current session was run. |
state | Current state of the session. |
activity_type | Type of the operation running in the session. |
query | Content of the SQL query running in the session. |
lock_name | Unique ID of the lock. |
lock_object_type | Type of the object to which the lock was applied. |
table_name | Name of the table to which the lock was applied. |
holder_application_name | Name of the application with the lock. |
holder_member | ID of the member with the lock. |
waiter_application_name | Name of the application waiting for lock. |
waiter_member | ID of the member waiting for lock. |
wait_time | Lock waiting time. |
The following items are the metrics collected if the XOS agent has been installed.
| Item | Description |
|---|---|
pid | PID of the database process. |
cputime | CPU usage time. |
cpuusage | CPU utilization |
elapse | CPU usage time. |
vsize | Virtual memory size (Kb) |
rss | Resident Set Size (RSS) that is the number of physical pages associated with the process. |
state | Process status. |
ioread | Actual time spent reading the block (milliseconds). |
iowrite | Actual time spent writing the block (milliseconds) |
pss | Process specific memory usage + Percentage of shared memory occupied by one process |
Downloading the view list
You can download the current Session Table list in CSV format. Select  on the upper right of the Session Table section.
The naming format of the downloaded file is as follows:
Viewing in a new window
You can see the Session Table list on a new wider screen. Select  on the upper right of the Session Table section.