Always On Monitoring
With Always On monitoring, you can check the replica configuration, synchronization state, and data movement metrics between replicas of a SQL Server Always On availability group (hereafter AG). By identifying the failover target configuration and the lag of secondary replicas, you can diagnose the health of an availability group.
WSFC (Windows Server Failover Cluster) is the Windows server cluster that SQL Server Always On runs on. An Always On configuration forms the following hierarchy.
WSFC Cluster              ← Group of Windows servers (handles failure detection/response, outermost)
  └ Availability Group (AG)    ← Group of databases replicated and failed over together
      └ Database    ← Actual protection target
When an AG is configured in the project, you can check related information in the following four places.
| Location | Description |
|---|---|
| Instance list | AG membership and replica node per instance (columns) |
| Availability group drawer | Replica configuration and synchronization state per cluster/AG (cards) |
| Availability group details | Summary, synchronization trend, replica table, and metrics for a specific AG |
| Always On monitoring dashboard | Data movement metrics, availability groups, topology |
Always On Information in the Instance List
When an AG is configured in the project and the related data (db_set_info) is collected, the instance list shows the Availability Group and Replica Server Name columns.
| Column | Description |
|---|---|
| Availability Group | List of AGs the instance belongs to. Role badges P (Primary) and S (Secondary) |
| Replica Server Name | Replica node name and the WSFC cluster it belongs to |
Click an AG name or the AG View button above the list to view the availability group details in a drawer.
Availability Group Drawer
When you click an AG name or the AG View button, the availability group drawer opens on the right. The drawer is organized by WSFC cluster, and the top summarizes the node, availability group, and database counts along with WSFC Cluster — {cluster name}.
If there are multiple clusters in one environment, switch the target cluster using the cluster selector at the top of the drawer. Because availability group names can be duplicated across clusters, only the availability groups belonging to the selected cluster are shown. You can also use the Availability Group selector to narrow down to a specific availability group.
Each availability group is shown as a card that represents its replica configuration and synchronization state.
| Item | Description |
|---|---|
| AG name | Identifier of the configured availability group |
| Synchronization state | Synchronized or Synchronizing |
| Replica count | Number of replicas in the AG (e.g., 4 Replicas) |
| Primary | Primary replica node that handles reads and writes |
| Secondary | Secondary replica node that receives replicated data. Multiple can be configured |
| Database | List of databases protected by the AG |
Click a card to open the details screen of that availability group. Click the Always On Monitoring button at the top of the drawer to move to the dashboard.
Availability Group Details
Click an availability group card to check its details in the following four areas.
Summary
The Summary area summarizes the synchronization state (Sync State), replica count (Replicas), database count (Databases), and database names (Database Names) of the selected availability group.
Synchronization State Trend
The Historical Synchronization States area shows synchronization state changes per replica (node) along a time axis. You can track intervals where synchronization was broken or points where the state changed to check stability. States are distinguished by color into Synchronized, Synchronizing, Initializing, and Not Synchronizing.
Replica Status
The Replicas table shows the detailed status of each replica, one row per replica.
| Column | Description |
|---|---|
| Replica Server Name | Replica node name and instance |
| Role | Replica role. Primary or Secondary |
| Sync State | Synchronization state of the replica |
| Failover Mode | Failover mode. Automatic or manual |
| Availability Mode | Availability mode. Synchronous commit or asynchronous commit |
| Details | Move to instance monitoring of the replica |
Metrics
The Metrics area provides data movement metrics between replicas in five charts. Use the Replica Server Name selector and the Database selector to narrow down metrics for a specific replica or database. The metric types are the same as Data Movement Metrics.
Always On Monitoring Dashboard
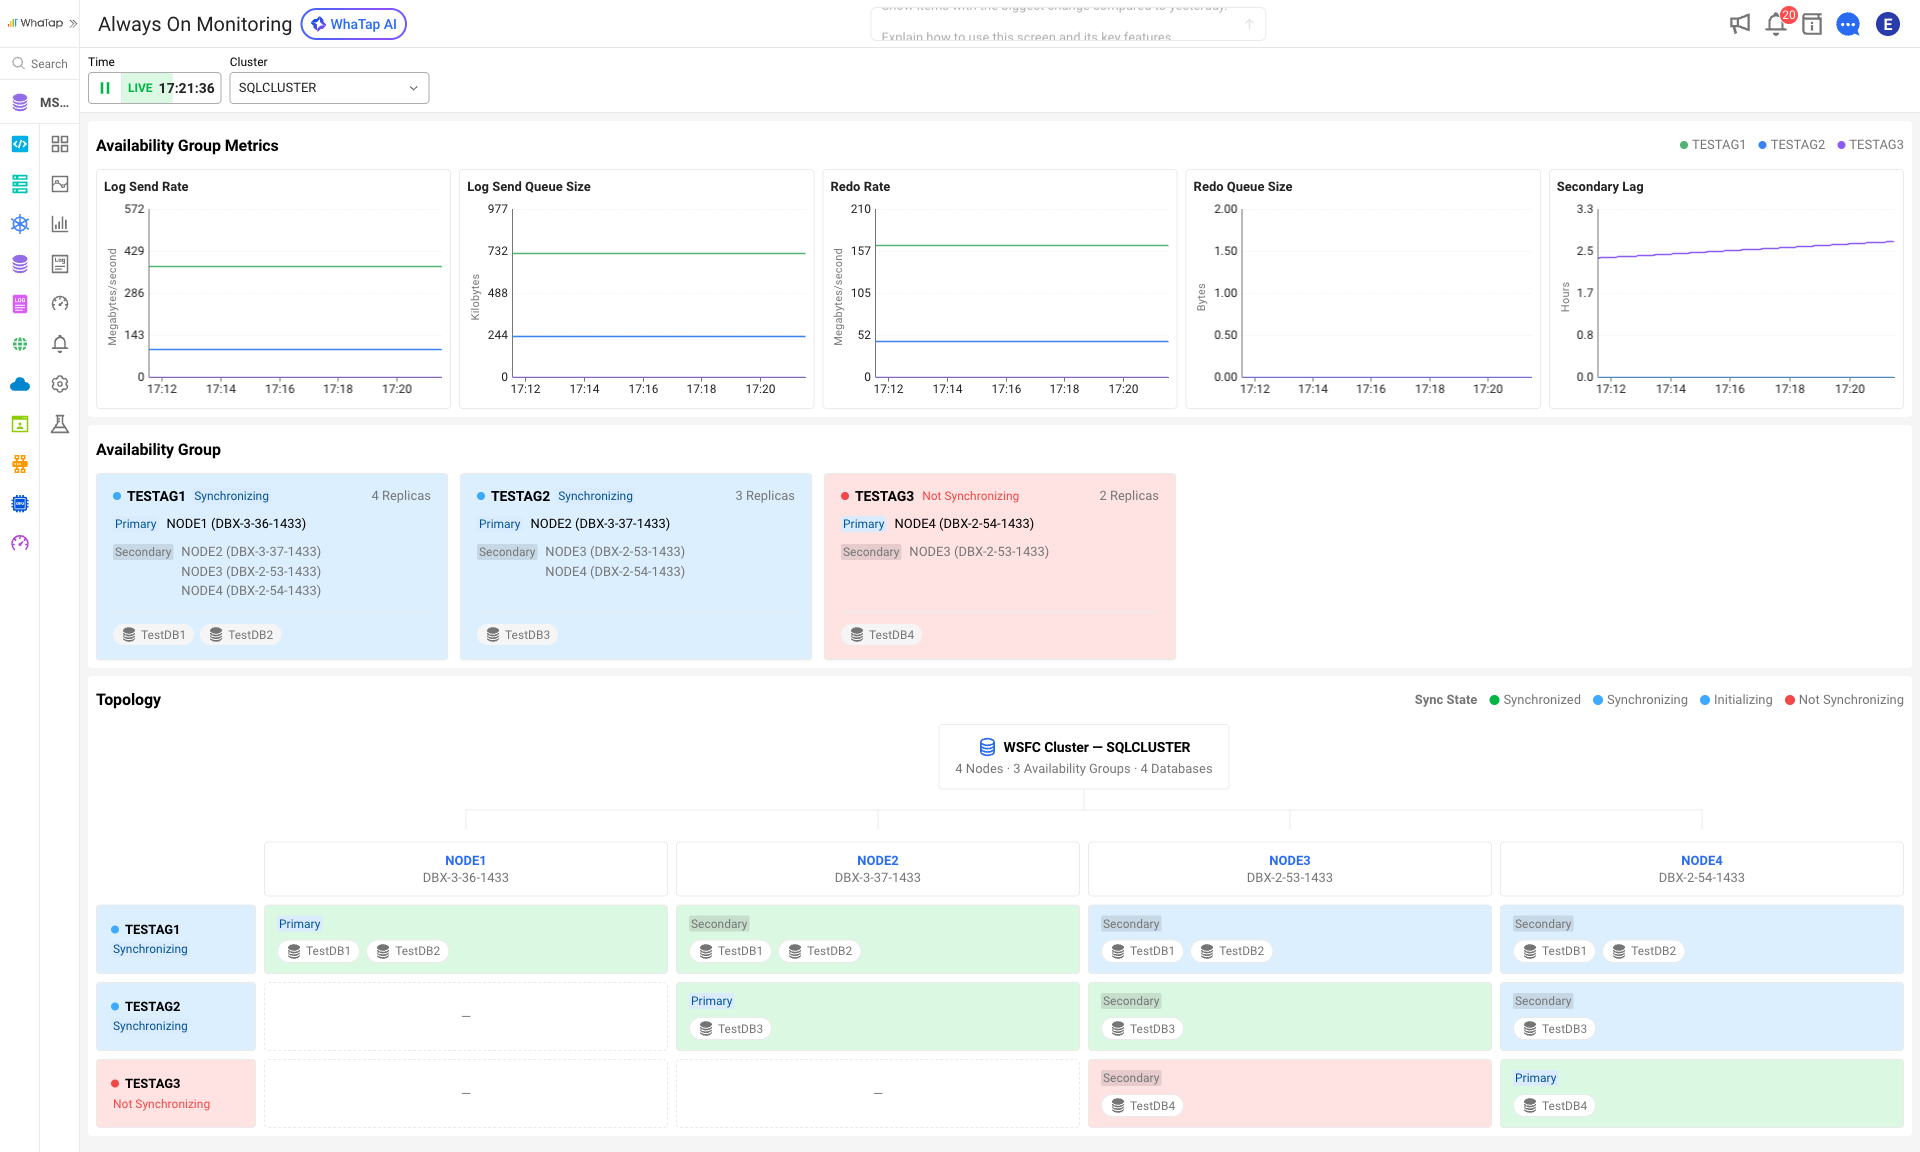
Click the Always On Monitoring button in the drawer, or go to Dashboard > Always On Monitoring in the sidebar. Switch the target cluster using the cluster selector at the top of the screen. From top to bottom, the screen consists of Availability Group Metrics (data movement metrics), Availability Group, and Topology.
Data Movement Metrics
This is the Availability Group Metrics section at the very top of the screen. Select the target AG using the availability group tabs at the top to check the data movement state between replicas in five charts.
| Metric | Unit | Description |
|---|---|---|
| Log Send Rate | byte/second | Rate at which the primary replica sends logs |
| Log Send Queue Size | byte | Amount of logs not yet sent to the secondary replica |
| Redo Rate | byte/second | Rate at which the secondary replica reapplies (redoes) logs |
| Redo Queue Size | byte | Amount of logs not yet applied on the secondary replica |
| Secondary Lag | second | Lag time of the secondary replica |
Each metric automatically converts its unit based on the maximum absolute value of the chart (e.g., KB, MB, GB; minutes, hours). Check the detailed description from the info icon next to the metric name.
Availability Groups
This is the Availability Group section that displays the availability groups configured in the selected cluster as cards. The card layout is the same as the Availability Group Drawer, and you can click a card to move to the availability group details.
Topology
The Topology section visualizes the replica configuration and synchronization state of availability groups as a matrix of nodes and AGs. The top shows WSFC Cluster — {cluster name} and the node, availability group, and database counts, and shows whether each node is Primary or Secondary per AG along with the databases it protects. Synchronization states are distinguished by color into Synchronized, Synchronizing, Initializing, and Not Synchronizing.