Agent Installation
This document has been created based on the SQL Server Monitoring V2. For the SQL Server monitoring V1 document, see the following.
The following guides you to the basic installation method for using the WhaTap database monitoring service.
To use the WhaTap monitoring service, after Sign in, create a project and install the agent to the target server. For more information about registration as a member, see the following.
See the following video guide.
Creating a project
Create a project before installing the agent.
-
Log in WhaTap monitoring service.
-
To create a project, on the left of the screen, select All Projects > + Project.
-
Select a product in Select product for installation.
-
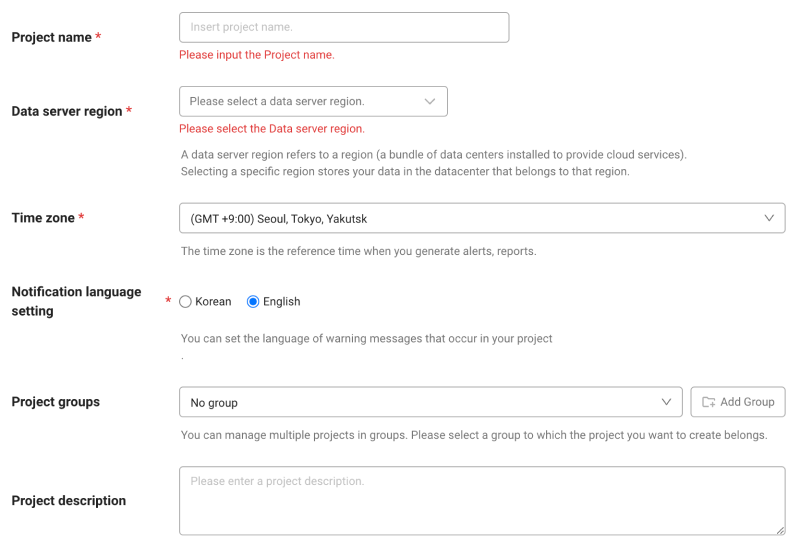
Configure the settings for Project name, Data server region, and Time zone.

-
In Notification language setting, select the language for alert messages.
-
After all settings are finished, select Creating a project.
-
A Data server region refers to a region (a bundle of data centers installed to provide cloud services). Selecting a specific region stores your data in the datacenter that belongs to that region.
-
Time zone is the reference time for generating alerts and reports.
-
To group multiple projects for management, select a group from Project groups or add a group. For more information about grouping, see the following.
-
To add a project with an organization selected, Groups of organization must be set.
Checking the configuration diagram
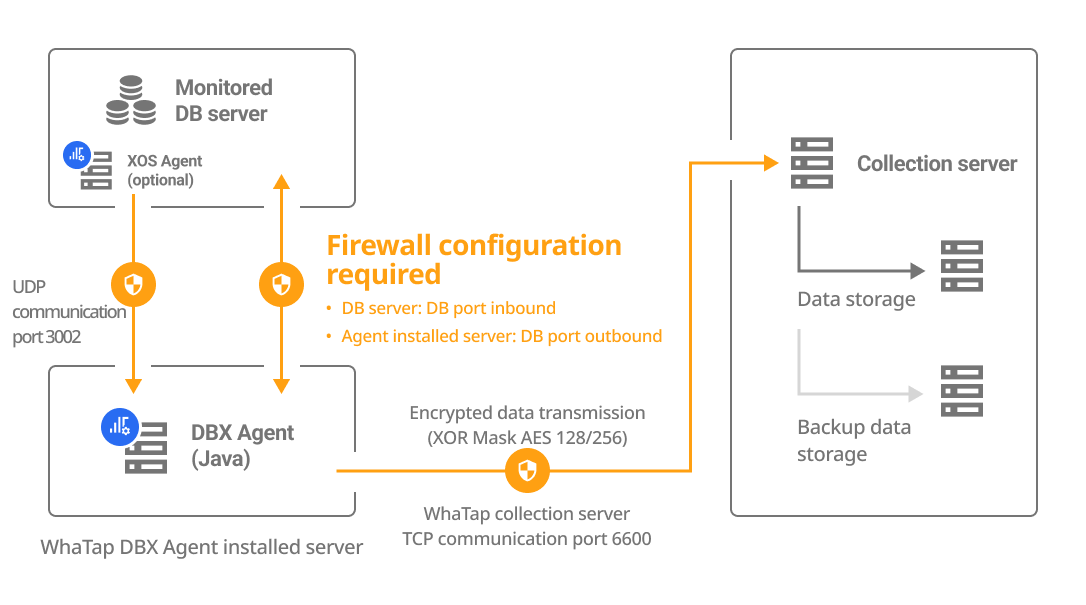
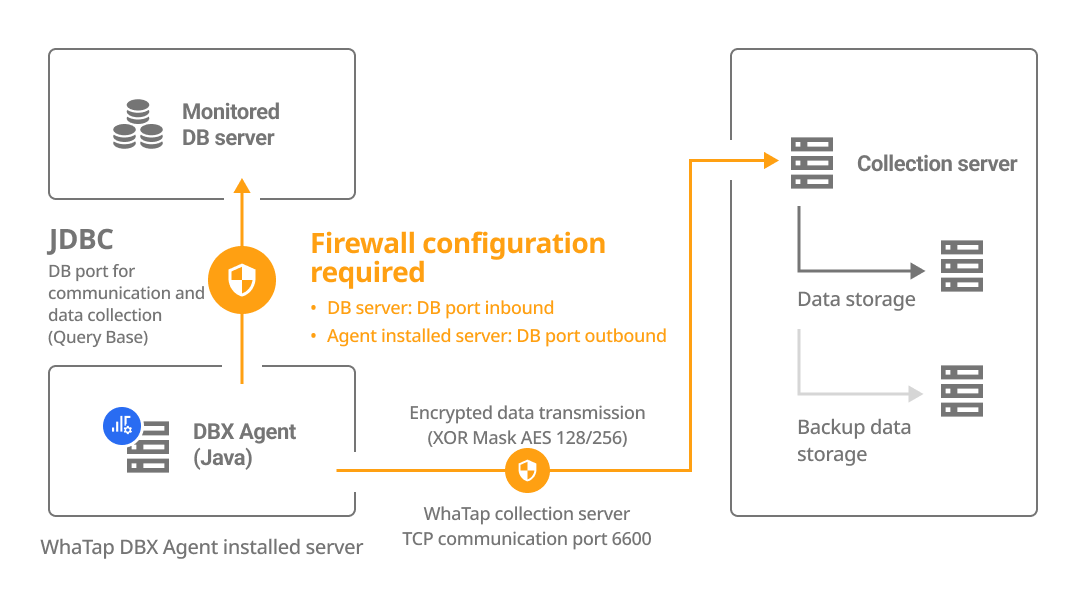
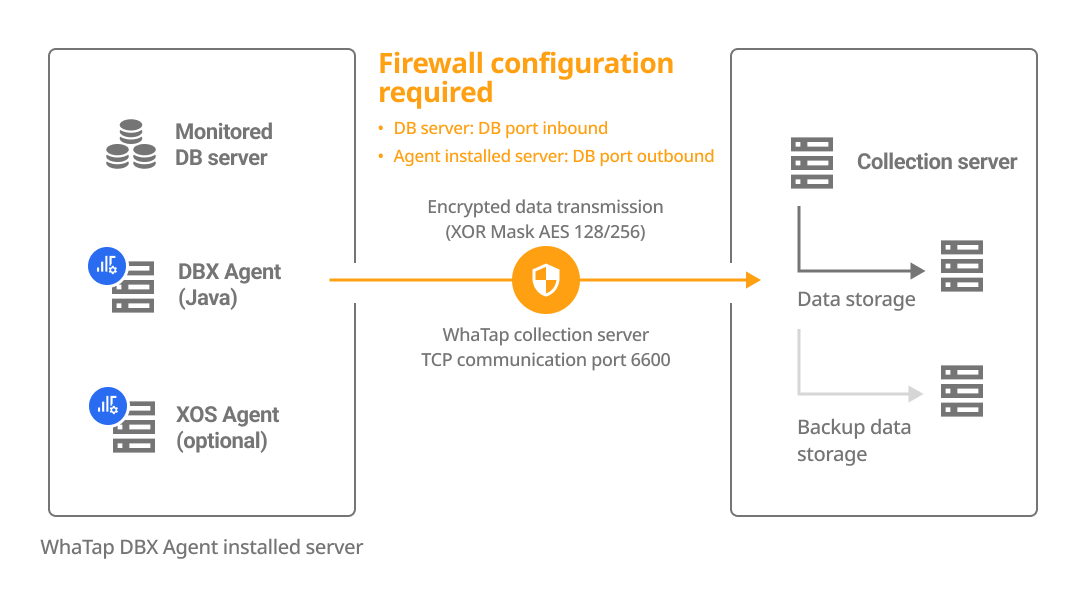
The DBX agent can be installed on a separate server or on the DB server. Select a method how to install the agent and check its configuration and firewall.
| Install on a separate server | Install on the DB server |
|---|---|
|
|
Account creation
Create an account with roles required for database monitoring. Log in with the root account and then create accounts.
- SQL Server 2014+
- SQL Server 2012 or earlier
- SQL Server 2008 or earlier
create login DB_User with password='DB Password';
create user DB_User for login DB_User;
grant connect any database to DB_User;
grant view server state to DB_User;
grant view any definition to DB_User;
create login DB_User with password='DB Password';
create user DB_User for login DB_User;
grant view server state to DB_User;
grant view any definition to DB_User;
You need to create an additional monitoring account and grant roles for each desired DB to monitor.
use DB_Name;
create user DB_User for login DB_User;
grant select, execute to DB_User;
create login DB_User with password='DB Password';
create user DB_User for login DB_User;
grant view server state to DB_User;
grant view any definition to DB_User;
EXEC sp_configure 'show advanced options', 1;
RECONFIGURE;
EXEC sp_configure 'Ole Automation Procedures', 1;
RECONFIGURE;
You need to create an additional monitoring account and grant roles for each desired DB to monitor.
use DB_Name;
create user DB_User for login DB_User;
grant select, execute to DB_User;
-
Additional roles when using the Kill session
grant alter any connection to DB_User; -
Additional roles when using the Kill session in the Azure SQL Database environment
grant kill database connection to DB_User; -
Roles required for use of Job Information and Backup/Recovery History menus
Grant roles to access the msdb database.
USE msdb;
CREATE USER DB_User FOR LOGIN DB_User;
GRANT SELECT to DB_User; -
Required roles when viewing object information
For the versions below 2014, connect to each DB to be monitored and grant roles.
grant view any definition to DB_User; -
Required roles when viewing plans
Connect to each DB and perform required tasks.
grant showplan to DB_User;
-
If you have an account with roles, skip this step and then proceed to Next Step.
-
In the example code,
DB_Useris the DB user account name. Change it to your account name.
- Enter your password in
DB_Passwordin the example code.
Checking the access key
The access key is the unique ID to enable the WhaTap service.
In the installation guide section, select Getting the access key. After the access key has been issued automatically, proceed to the next step.
After a project has been created, the Agent installation page appears automatically. If the Agent installation does not appear, select Management > Agent installation on the left of the screen.
Downloading the DBX agent
Download the DBX agent file. Use the following two methods.
-
You can download it by using the 'wget' command.
BASHwget -O whatap.agent.database.tar.gz "https://service.whatap.io/download/dbx_agent?type=mssql&format=tar.gz" -
If you cannot download it with the command, select Download on the WhaTap monitoring service screen.
Download the DBX agent file and then unzip it.
tar -zxvf whatap.agent.database.tar.gz
For users who cannot download tar files due to security settings, ZIP files are also provided. On the installation screen, select the .zip Download button.
DBX Agent Setting
Follow the instructions on the agent installation screen to configure the agent. By entering the required items on the screen, the configuration and commands can be auto-completed.
whatap.conf configuration
Go to the unzipped folder and then check the whatap.conf file. In whatap.conf, enter the project access key, WhaTap server data, and DB connection data.
license=x6054vg8d8e5e-z16ovlmhlau3st-z2uj26egaj4mt4
whatap.server.host=13.124.11.223/13.209.172.35

dbms=mssql
db=master
db_ip=127.0.0.1
db_port=1433
In case of occurrence of SSL authentication issues
If any SSL authentication issue occurs, set the following options in the whatap.conf file.
connect_option=?encrypt=true;trustServerCertificate=true
Downloading JDBC
Download the JDBC driver that matches the operating system and version of the database server to the DBX agent path where you unzipped the file. /unzipped folder/jdbc
MS SQL 2005 or later
In /unzipped folder/jdbc/README.md, you can also see the JDBC driver installation paths for each database.
DB user file creation
Generate an encrypted UID for database connection. Enter the username and password and then run the shell script (or batch file).
- Windows
- Linux
uid.bat "DB_USER" "DB_PASSWORD"
-
After setting it once, it collects data from the database server to be monitored through the encrypted UID.
-
To create a DB user file, enter the project access key in the whatap.conf file. Checking the access key
-
In the Azure database environment, enter
DB_USERin the form of DB_USER@DB_name. -
On Windows, the escape character (
\) is not required for special characters in a password. However, it is required when using double quotes (") within the password.
./uid.sh {DB_USER} {DB_PASSWORD}
-
After setting it once, it collects data from the database server to be monitored through the encrypted UID.
-
To create a DB user file, enter the project access key in the whatap.conf file. Checking the access key
-
In the Azure database environment, enter
DB_USERin the form of DB_USER@DB_name. -
If special characters are included in
DB_USERorDB_PASSWORD, enter the escape character (\) together before any special characters.Example./uid.sh whatap whatap\!pwd
# If there are multiple special characters, add the escape character(\) for each.
./uid.sh whatap whatap\!\@pwd
Starting the monitoring
Execute a shell script (or batch file) from the path where you have installed the agent.
- Windows
- Linux
start.bat
Check whether there are any errors in the execution log displayed on the screen, and check whether a chart appears normally on the dashboard screen (Instance List). If there is no problem, press Ctrl+C to terminate the execution, and then register it as a Windows service in the following order.
Registering a service
Execute the following command to register a service.
install_WindowsService.bat create WhatapDBXAgent
When a service is registered, you can check it in the service management tools as shown below. Find the service, right-click it, and then select the Start option to start the service.

In Control Panel > Windows Tools > Services (services.msc), you can start or stop the WhatapDBXAgent service. Depending on the Windows version, the service path may differ.
Deleting a service
Execute the following command to delete a service.
install_WindowsService.bat delete WhatapDBXAgent
./start.sh
To use it like a daemon, execute the following command. However, it works only in the environment where nohup has been installed.
./startd.sh
Installing the additional agent (XOS) and applying other options
To additionally monitor the resources of the database server, run a separate XOS agent process on the database server to collect data.
-
It can be applied to only the OS environment running on the x86 architecture.
-
The additional agent installation process is optional.
- For more information about the XOS agent configuration options, see the following.
- To additionally collect and monitor monitoring metrics provided by cloud services on the dashboard of the database project, see the following.

Configuring the whatap.conf file
Set the following options in the whatap.conf file in the path where the DBX agent has been installed.
xos=1
xos_port=3002
Move the xos folder (/unzip folder/xos/) to the database server.
Configuring the xos.conf file
Set the following options in the xos.conf file in the xos path moved to the database server.
dbx_ip={DB_Agent_IP}
dbx_port=3002 # default 3002
cpu_limit=0
mem_limit=10240
In Agent Installation, when you enter the DB data to DB Agent IP and DB Agent Port, the agent options are automatically generated.
Running the XOS agent
- Windows
- Linux
Run the agent with a batch file in the xos folder.
start.bat
After confirming that there are no errors in the execution log displayed on the screen and terminating the execution, register for the service in the following order.
-
Service registration
Register in the service by running the install_WindowsService.bat file in the xos folder as follows. If you do not enter a name after the
createoption, the service is registered by default with the name of WhatapXOSAgent.install_WindowsService.bat create WhatapXOSAgent -
Deletion of a service
install_WindowsService.bat delete WhatapXOSAgent
To transmit monitored data to the DBX agent, the port set to dbx_port (default 3002) must have been open. (UDP Outbound)
-
Grant the role to run the XOS agent.
chmod +x ./whatap.agent.xos* -
Run the XOS agent.
./start.sh
-
To transmit monitored data to the DBX agent, the port set to
dbx_port(default 3002) must have been open. (UDP Outbound) -
To run the XOS agent in the background, run the ./startd.sh file.
Next steps
-
Checking the installation
If you have created a project, installed an agent, and applied all agent options, see the checklist in the following.
-
Installation troubleshooting
It provides various problems that may occur when installing the agent and specific instructions for resolving them. For more information, see the following.
-
Agent setting
It provides various features for monitoring by applying some options to the agent configuration file (whatap.conf). For more information, see the following.
-
Cloud Settings
To additionally collect and monitor monitoring metrics provided by cloud services on the dashboard of the database project, see the following.
-
Starting the monitoring
After configuring all settings, the agent starts collecting metrics data from the database server. First, check whether the monitoring data has been collected in Instance List. For more information about Instance List, see the following.

