Pod Startup Analysis
Home > Select Project > Analysis > Pod Startup Analysis
It is supported by WhaTap Node Agent 1.4.2 or later. If the version is lower, the Previous menu (formerly Pod initialization performance) screen is provided.
For smooth cluster operation, it is required to analyze the performance of Pods until they operate stably and optimize the size of resources allocated to Pods. The Pod Startup Analysis menu traces the change for 5 minutes after the Pod starts. You can optimize resource allocation by analyzing the resource usage in the three-level sections from Pending state to Running state and Stable Running state.
Through this, operators can have benefits such as improved resource efficiency, cost savings, improved scalability, and ease of scaling.
Basic screen guide
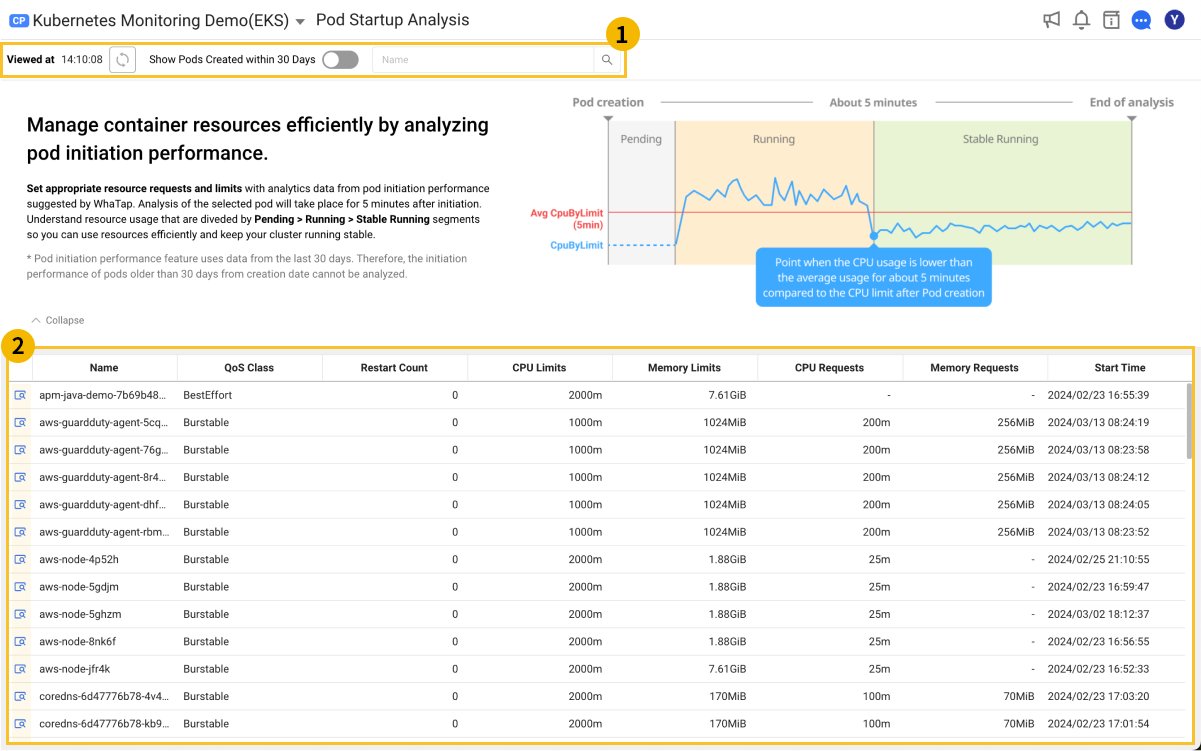
Option area at the top
You can use the following options in the top ![]() area.
area.
-
By selecting the
 Refresh icon, you can reload the Pod list in the
  area.
area. -
By enabling the Show only Pods created within 30 days
 toggle, you can view the Pods within 30 days after creation in the Pod list in the area.Note
The Pod Startup Analysis menu analyzes the Pod startup data for 5 minutes within the last 30 days starting from Pod creation. This means that the startup performance cannot be analyzed for Pods that are older than 30 days after creation.
-
You can search for the desired Pods by entering characters in the Pod search field.
Pod list area
In the ![]() area, you can see the Pod list. The header columns of the table where the Pod list is expanded contains the following data.
area, you can see the Pod list. The header columns of the table where the Pod list is expanded contains the following data.
-
QoS Class: Quality of Service of the Pod. QoS classes determine the priority of Pods when resources are insufficient. Pods with higher priorities are terminated first.
-
Guaranteed: Most available resources in the node are guaranteed and are assigned priority over other Pods. It is terminated last.
-
This is the case when all containers in the Pod have CPU and memory requests.
-
This is the case when all containers in the Pod have CPU and memory limits and their values are the same as the requests.
-
-
Burstable: The Pod allocates some resources when the node runs out of resources.
-
This is the case when the conditions of the Guaranteed class are not met.
-
This is applied when any of the Pod's containers have requests or limits set for CPU and memory.
-
-
BestEffort: It has lower priority than other Pods because there is no resource request or limit. It is terminated first.
- This is the case when all containers in the Pod have no requests and limits for CPU and memory.
-
-
Restart Count: Total number of restarts of containers within the Pod.
-
CPU/Memory Limits: Sum of CPU/memory limits (
resources.limits) set to the container within the Pod. -
CPU/Memory Requests: Sum of CPU/memory requests (
resources.requests) set to the container within Pod. -
Start Time: Pod generation time (
metadata.startTime).
-
For more information about the QoS Class, see the following link.
-
For more information about the Pod and container resource management, see the following link.
Detailed view guide
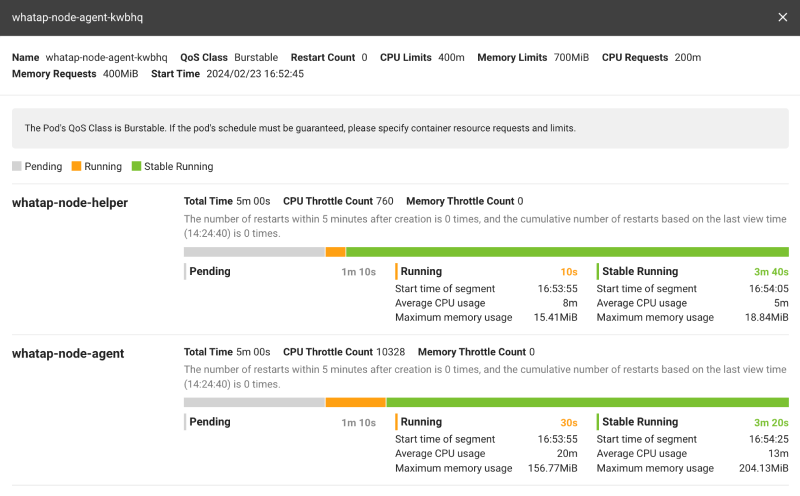
From the Pod list of the ![]() area, select
area, select ![]() Display Detail at the utmost left of the item to analyze. You can see the analysis of the startup performance by container in the selected Pod for each zone as follows.
Display Detail at the utmost left of the item to analyze. You can see the analysis of the startup performance by container in the selected Pod for each zone as follows.
-
Pending: Section that enters the Running state after creation of a Pod.
-
Running: Section before the Pod passes the Pending state and becomes stable.
-
Stable Running: Section where the Pod has passed the Running state and has stabilized.
Stable state (Stable Running)
WhaTap calculates the average usage compared to the container's CPU limit for about 5 minutes immediately after Pod creation. The point at which CPU usage becomes less than this average is defined as the stabilization start state.
Analyzing in detail
-
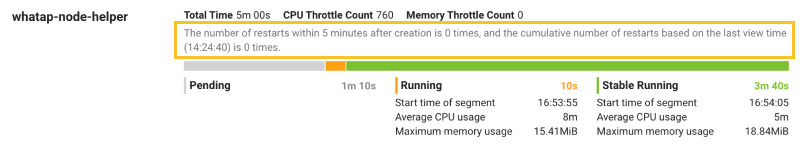
If a container is restarted multiple times within 5 minutes, only the information of the container that started first appears. Check the number of restarts for each container. If there are numerous restarts, check whether the container is running normally.
-
If the Pending section becomes longer, it means that it took a long time for the Pod to enter the Running state. Check if there are any factors that may cause the Pod's Pending state.
NoteFor more information about the Pod's pending state, see the following link.
-
If the Running section becomes longer, it means that there is a section with high resource usage when the container in the Pod first runs. Check if there is any problem with the container execution process.
-
If the overall initial resource usage is high, consider increasing container resource requests and limits.