Service 2.15.X
Service 2.15.4
April 4, 2025
MySQL v2, Oracle V2, Oracle Pro
This error occurs only in DB Agent 2.4.0 or later.
-
FixedIn Top SQL Comparison, fixed the bug where charts for the past are not displayed. -
FixedFixed the error where a query is displayed as undefined in the SQL Detail window when a query statement is clicked in Top SQL Comparison.
Service 2.15.3
April 2, 2025
Server
Fixed In Server List > Server Detail, fixed the issue where not all items are loaded when viewing Process List.
Service 2.15.2
March 31, 2025
Kubernetes
Changed In APP. > Statistics, changed the data query range up to 15 days.
Service 2.15.1
March 27, 2025
Common
-
FixedIn Flex Board, fixed the issue where favorites are cancelled.
 -
FixedIn the Alert status list, fixed the issue that occurs when a deleted notification is selected.
 -
FixedFixed the issue where the time changed using the time selector to the calendar is not reflected during a search.
Database
Fixed In Analysis > Top SQL Comparison, fixed the error that occurs during a search after changing the search criteria.
SAP ASE
Feature In Analysis > Database Parameter, added the feature to view real-time database parameters when both Reference date and Comparison date are present.
Service 2.15.0
March 26, 2025
Release of new features
It provides a guide to the new features released in Service 2.15.0.
Database
-
NewLaunched the SAP ASE monitoring product.NoteFor more information about the SAP ASE monitoring product, see the following.
-
NewIn the Oracle and Oracle Pro platforms, added a new menu, Dashboard > RAC Monitoring.NoteFor more information about the RAC Monitoring menu, see the following.
Application
New In the Java platform, added a new menu, Dashboard > Agent Resource Dashboard.
For more information about the Agent Resource Dashboard menu, see the following.
Common
-
FeatureIn Dashboard list of the Integrated Flex Board menu, added the feature to check and remove shared users in the Sharing a dashboard modal. -
FeatureIn Flex Board, added the feature to select a project by using the keyboard on the project selection window within a widget. -
FeatureAdded the group name searching feature upon searching a project in the widget of the Flex Board menu. -
FeatureAdded the option to allow only SSO logins. -
FeatureAdded the feature to grant the payment role via email approval. -
FeatureAdded the feature to grant the payment role to a lower level group (group, project) in bulk. -
FeatureAdded the time selector's selection time retention feature.NoteIt may not be applied to some menus such as Report.
-
FeatureChanged the settings of Alert status to save as personal settings. -
FeatureAdded the recipient filtering feature in Alert status. -
ChangedChanged to open in a new window when a notification is clicked in the Alert status list. -
ChangedChanged the speaker icon when activating sound without any notifications in the notification list. -
ChangedIn the previous Alert > Event Configuration menu, moved the Agent Inactive Warning interval selection option to the Management > Agent List menu. -
ChangedAdded the confirmation process when deleting saved presets from the preset list. -
ChangedWhen deleting Flex board saved from Dashboard list, added the confirmation process. -
ChangedIn Analysis > Metrics ChartNew, modified the last selected time to be retained even when closing the sidebar. -
ChangedIn My Usage > Metering, changed the usage detail table upon billing by the namespace unit. -
ChangedIn Billing History and Invoice Preview under the My Usage menu, added the expression for namespace-unit billing of any Kubernetes target. -
ChangedImproved the filtering behaviors of the sidebar project list.-
Changed the behaviors to be the same as unselecting all.
-
Modified to display all groups upon selection of all.
-
-
ChangedImproved the filter usage method so that filters are applied immediately when closing the filter window or clicking the Apply button.Filter approved menu
-
 Sitemap > Metrics Chart
 Old -
Sitemap > Metrics Anomaly Detection
-
Sitemap > Laboratory > Integrated Log Search
-
Site management > Metrics > Rebuilding Metrics
- Flex Board
- Integrated APP. Topology
- Real-time Alert List
-
Server monitoring > Report > Daily server report
-
-
ChangedIn Flex Board, modified the icon's background color to white upon addition of a widget. -
ChangedChanged the URL product icon in the project list upon selection of a product. -
ChangedIn Account Management, changed the form not to display the warning message when there is no input value when changing the password. -
ChangedIn Account Management, changed the checkbox UI for the days of the week when setting the notification reception. -
FixedDisplayed the group name of the project selected in the sidebar. -
FixedIn Report, fixed the issue where the theme color is not applied in the options area at the top. -
FixedIn Management > Maintenance Plan, fixed the broken theme color and style. -
FixedFixed the issue where the time does not stop when the timer is clicked if the time selector in section mode is in real-time status. -
FixedIn Agent CONF. and Server CONF., fixed the issue where the options cannot be removed from Object kind default, Project default.
Application
-
FeatureIn Statistics > Transaction, added the maximum value displaying feature in the detailed statistical chart. -
FeatureInInstance Performance Management > Thread List/Dump, added the text download feature. -
FeatureIn Instance Performance Management > Loaded Classes, added the Class details copying and txt downloading features. -
FeatureIn Instance Performance Management, enlarged the width of the search UI. -
ChangedIn Analysis > Transaction Search, changed the CSV downloading method. -
ChangedIn Agent CONF.Old, modified the API calling method enabled by clicking Apply to All Agents. -
ChangedChanged the location of the UI that displays the number of transactions in the Active Transaction Speed Chart chart. -
FixedIn Analysis > Stack, fixed the issue where images are captured abnormally during a download. -
FixedIn Analysis > Transaction Search, fixed the issue where the data from the previous page is overlapped when viewing the data from the next page. -
FixedIn the Multi transaction tab and Multiple Transaction Trace menu inside the Trace analysis window, fixed the issue where node clicks do not work when there are multiple starting point transactions. -
FixedIn Instance Performance Management > Thread List/Dump, fixed the issue where thread dumps did not appear. -
FixedFixed the issue where the pre-selected agent is not automatically selected when you enter into the Instance Performance Management > Agent CONF.Oldmenu. -
FixedModified the agent selector's design.-
Fixed the issue where selection status is not visually displayed when selecting an agent.
-
Fixed the cursor to be changed to a pointer when hovering over an agent.
-
Fixed the issue where the icon appears blurry when hovering over the modification icon.
-
Java
Fixed In Management > Agent Installation, modified the Add JVM options guidance.
Server
-
FeatureIn Server List > Server Detail, added the memory capacity displaying feature within the Memory column in the Process list. -
FeatureIn Server List > Server Detail, added the activation toggle for the inactive server upon Select server. -
FeatureIn Server List > Server Detail , added the Disk Used Space (%) chart. -
FeatureIn Server List > Server Detail, added the File System tab in the lower right corner. -
ChangedIn Alert > Event Configuration, changed the Active toggle style in Event rule condition when adding or modifying the server events. -
ChangedIn Alert > Event Configuration, changed the guidance modal style when changing the event type for adding or modifying server events. -
ChangedIn Server List > Server Inventory, changed the previous status column name to Connection status. -
ChangedIn Server List > Server Inventory, changed the column name of the previous whatap_infradVersion to Agent Version. -
ChangedIn Server List > Server List, changed the operation method of the Management feature.-
Restart / Paused: Changed the action confirming method through the previous tooltip to a pop-over method.
-
Exception:
-
Changed Cancel to Exception.
-
Changed the action confirming method using a tooltip to the method of checking the list of selected agents through a modal and directly entering
deleteto exclude them.
-
-
-
FixedServer List > Server List Fixed intermittent whiteout when entering menus. -
FixedIn Server List > Server Detail, excluded theZFSfile system when summing the disk total capacity.-
Excluded targets:
FUSE,NFS,NFS4,NFSD,PNFS,CIFS,SMBFS -
Additional exclusion:
ZFS
-
-
FixedIn Server List > Server Detail, fixed the issue where the conditions and server list in the Server Alert List drawer inside the Server information panel is cut off and the entire content is not visible. -
FixedIn Server List > Server Inventory, fixed the issue where the column name is not displayed in the table header when selecting the Agent Version column. -
FixedIn Server List > Server Inventory, fixed the issue where the OS icon size is changed when adjusting the OS type column's size. -
FixedFixed the issue where thepausedserver in the honeycomb view of the Dashboard > Resource board > Server Status Map panel is displayed inokstatus. -
FixedIn Dashboard > Resource board, fixed the issue where some servers are hidden when the server selection panel list becomes long after dragging the CPU Resource Map chart and moving CPU Resource Map becauses the scroll is not displayed. -
FixedIn Flex Board, changed thepausedstate color of the Server status widget to match the color of the Resource board.
Kubernetes
-
FeatureIn Container > Out Of Memory Killed Container, added the container name searching feature. -
FeatureAdded the tag meta information in the Container > Out Of Memory Killed Container menu. -
FeatureIn Container > Out Of Memory Killed Container, added the Container Memory Working Set By Limit chart into the detail drawer to display the memory utilization (%) against the container limit. -
FeatureIn Management > Agent Installation, added the multilingual guidance whenwhatap.server.hostinenvis not recognized during the guide to the Docker Java installation. -
FeatureIn the detailed view of Analysis > Kubernetes Event, added the Pod summary analysis and Node summary analysis tabs. -
FeatureIn the detailed view of Analysis > Object Manifest, added the search feature. -
ChangedReorganized the sidebar menu structure.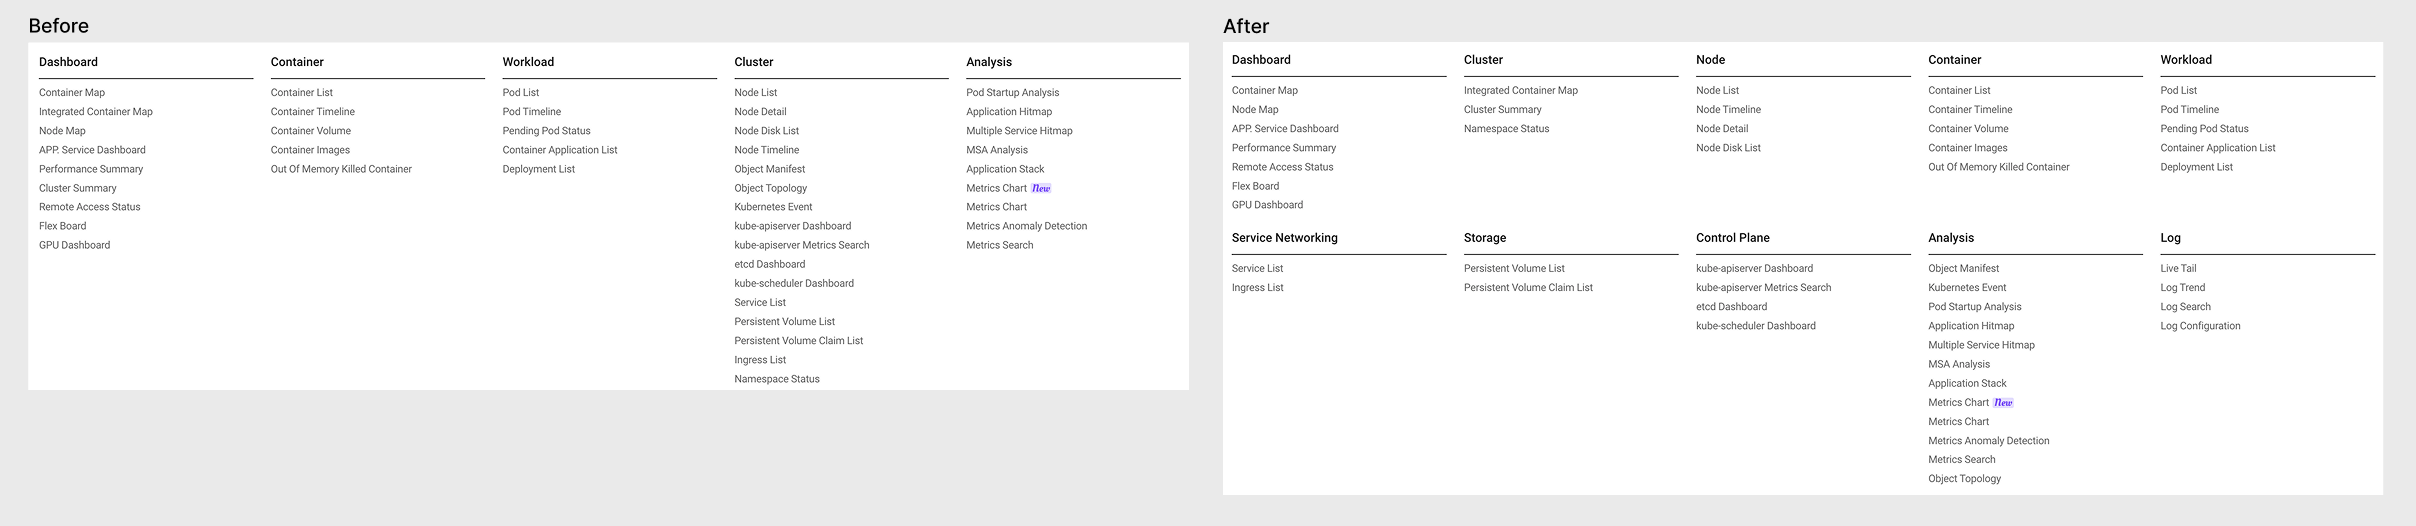
-
ChangedIn the Log > Container Stdout/Stderr tab under the summary view of Dashboard > Container Map, changed the container selection option UI. -
ChangedIn Container > Out Of Memory Killed Container, renamed the container memory utilization chart under Display Detail.-
Before: Memory Working Set per Container (byte)
-
After: Container Memory Working Set
-
-
ChangedIn Container > Out Of Memory Killed Container, changed the Pod memory utilization chart under Display Detail.-
Before: Memory utilization chart
-
After: Changed to the Pod Memory Working Set By Limit chart that displays the utilization (%) against the limit.
-
-
FixedIn the card view of Project List, changed not to display the Edit Project Name option in case of the namespact project. -
FixedIn Node > Node List, fixed the issue where theZonecolumn sorting does not work. -
DeprecatedIn Container > Out Of Memory Killed Container, removed thestatecolumn.
Database
Common
-
FeatureIn Dashboard > Monitoring a Database Instance, sorted the instance selector options alphabetically. -
FeatureIn Dashboard > Monitoring Multiple Instances, added the Database Map widget. -
ChangedIn Dashboard > Monitoring a Database Instance, changed the database list at the top to display more tags. -
FixedIn Analysis > Lock Tree, fixed the issue where some bar charts do not appear. -
FixedIn Dashboard > Monitoring Multiple Instances, modified the area margins at the top.
Altibase, Cubrid, MySQL, PostgreSQL, SQL Server, Oracle V2, Oracle Pro, IBM DB2
Fixed In Dashboard > Monitoring Multiple Instances, changed the order of table columns and adjusted the default width when dragging the SQL Elapse Map widget.
PostgreSQL, Oracle, MySQL, SQL Server, Cubrid, Altibase V2, IBM DB2
Feature In Management > Agent Installation, added the troubleshooting guide when msvcp120.dll and msvcr120.dll are missing under the XOS (Windows) tab of the Install the additional agent (XOS) on DB server and set other options section.
MySQL, PostgreSQL, Oracle, Oracle Pro
Fixed In Dashboard > Flex Board, changed the order of table columns that appear when dragging Elapse Map .
MySQL, Oracle V2, Oracle Pro
Feature Laboratory > Added the new Top SQL menu.
Oracle V2, Oracle Pro
-
FixedIn Dashboard > Monitoring a Database Instance, modified to display the tooltip in the whole content after displaying the ellipsis (...) when theFILTER_PREDICATESandACCESS_PREDICATEScolumns are too long in the SQL details window that appears by clicking a query in the Active sessions tab. -
FixedIn Dashboard > Flex Board, changed theusernamecolumn in the table that appears by clicking Elapse Map to theschemanamecolumn. -
FixedIn Dashboard > Monitoring Multiple Instances, changed theusernamecolumn in the table that appears by clicking Elapse Map to theschemanamecolumn.
{/* {
"ver": "Service 2.15.0",
"hash": "service-2150",
"product": "Database",
"type": "Fixed",
"desc": "<p><code class=\"Fixed\" type=\"0\">Fixed</code> In the <span class=\"uitext\">Dashboard</span> > <span class=\"uitext\">Multi Instance Monitoring</span> menu, modified the <code>planHash</code> value to default to <code>plan_hash_value</code> of the query on the left in the <span class=\"uitext\">SQL Details</span> window that appears by clicking a query in the table that opens after dragging <span class=\"uitext\">Elapse Map</span></p>",
"category": "Oracle V2, Oracle Pro"
}, */}
MongoDB
Feature In Dashboard > Monitoring a Database Instance and Monitoring Multiple Instances, added the DocumentDB preset.
IBM DB2
-
FeatureAdded the Tablespace Size menu that allows you to monitor the tablespace usage status under Stat/Report menu. -
ChangedChanged some columns in the Lock tree table.
Log
-
FeatureIn the Log Configuration > De-identification of personal information tab, added the checking process upon Start inspection after selecting Replace. -
FeatureAdded the feature to check sample logs for inspection results after completing inspection in the Log Configuration > De-identification of personal information tab. -
FeatureIn Log Configuration > De-identification of personal information tab, added the Check inspection history feature.