LLM Prompt Log
Home > Select Project > Log > Prompt Log
Prompt Log is a menu for viewing and analyzing detailed logs of LLM API calls. You can check inputs (prompts), outputs (responses), token usage, costs, and performance metrics for each individual call. Use this menu to drill down and identify root causes after spotting anomalies in token trends or cost analysis.
This menu requires Log Read permission. Without the permission, the menu is not accessible.
Screen Layout
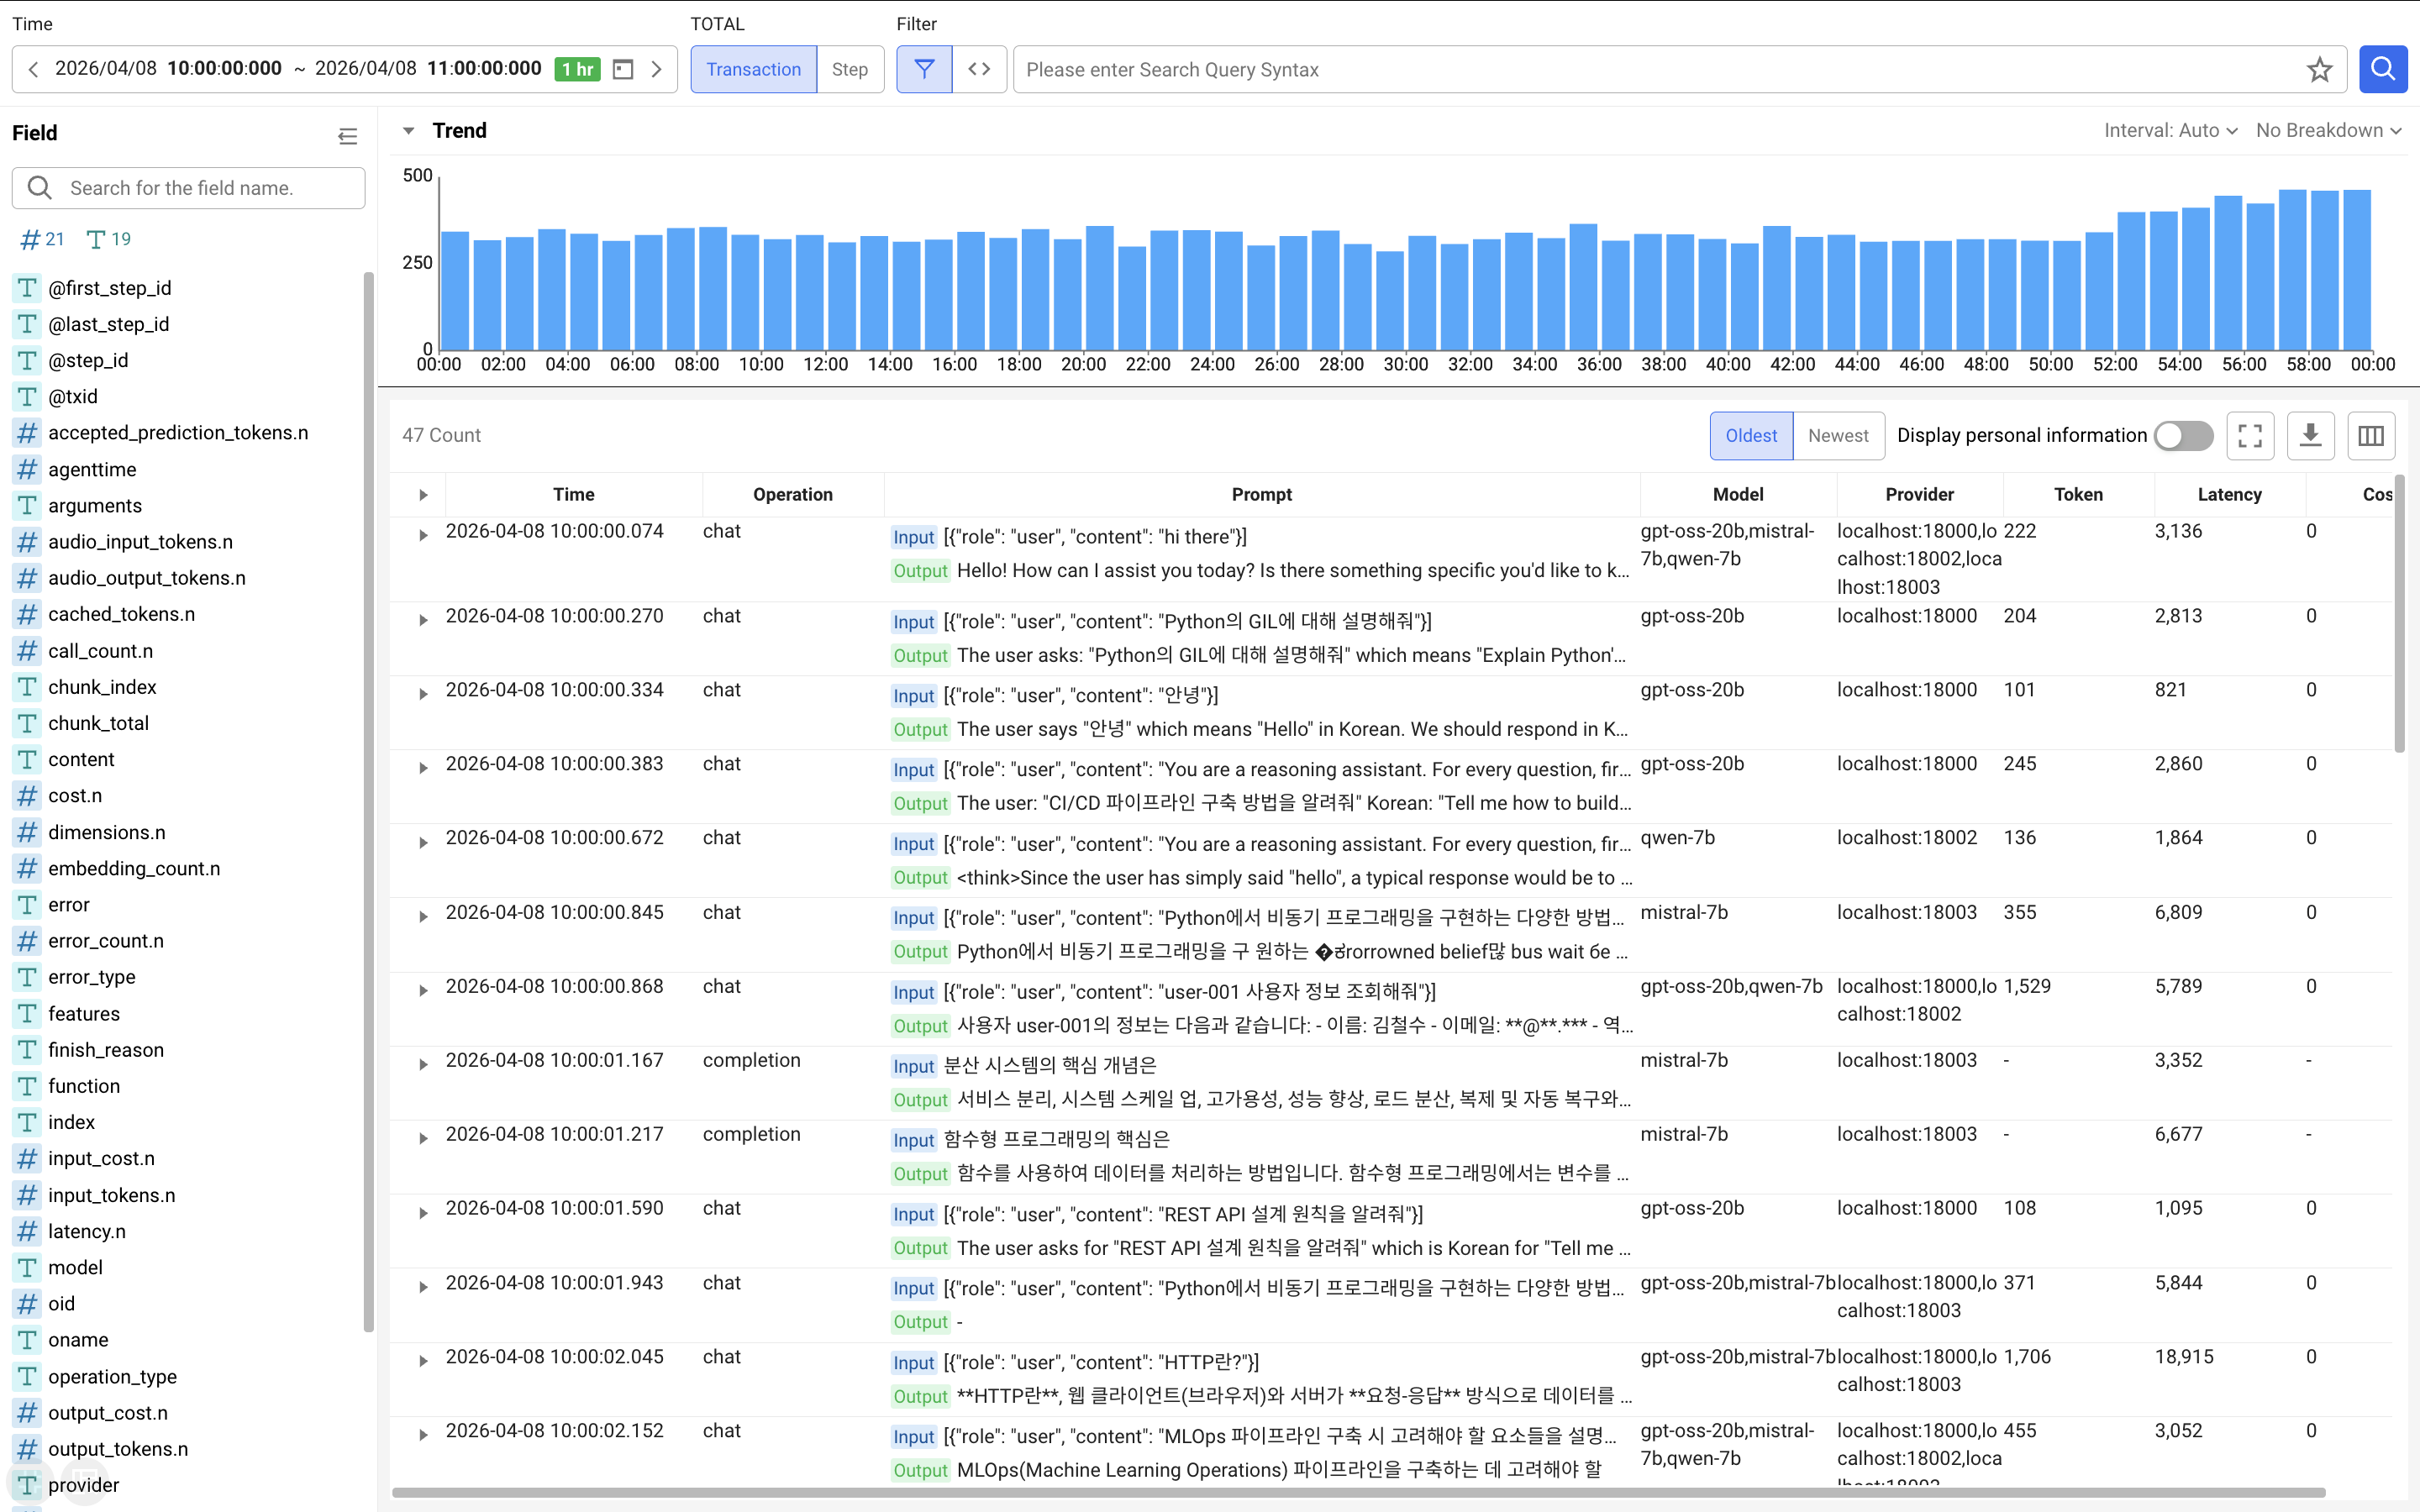
Prompt Log consists of a three-panel layout: top option bar, left filter panel, and right main area (trend chart + log list).
Top Option Bar
- Time range selector: Specify start and end times. Quick select options are available (last 5 min, 10 min, 30 min, 1 hour, 3 hours, 6 hours, 12 hours). You can specify down to seconds and milliseconds.
- Merge criteria: Select the criteria for merging logs.
- Transaction: Merges all LLM calls within a single transaction into one row. Call Count and Error Count are displayed together.
- Step: Displays each individual LLM call (Step) as a separate row. You can check details such as model, temperature, and TTFT for each call.
- Filter: Enter search queries to view only logs matching specific conditions.
Left Filter Panel
Provides tag-based filters for log fields. Value lists for each field are displayed and can be clicked to apply filters.
Trend Chart
Displays the log count for the selected time range as a bar chart by time period. You can collapse or expand the chart to adjust space, and drag the divider between the chart and log list to adjust proportions.
Log List
Displays LLM call logs in a table format. The columns displayed vary depending on the merge criteria (Transaction/Step).
Default Columns
| Column | Description |
|---|---|
| Status | Indicates error status by color. Rows with errors are displayed in red. |
Time | Log timestamp |
Operation | Operation Type of the LLM call |
Prompt | Summary of prompt input and response. Click to open the transaction profile pop-out. |
Model | LLM model name used |
Provider | LLM provider (e.g., api.openai.com) |
Tokens | Total token count (Input + Output) |
Latency | Time from request start to response completion (ms) |
Cost | Cost of the call ($) |
Transaction Mode Columns
| Column | Description |
|---|---|
Call Count | Number of LLM calls within the transaction |
Error Count | Number of calls with errors within the transaction |
Step Mode Columns
| Column | Description |
|---|---|
Step | LLM call sequence index within the transaction |
Step ID | Unique identifier of the individual LLM call |
temperature | Temperature parameter value set for the LLM call |
TTFT | Time To First Token (ms). Displayed only in streaming mode. |
Additional Columns
Additional columns can be displayed through column settings.
| Column | Description |
|---|---|
Input Tokens | Number of input tokens |
Output Tokens | Number of output tokens |
Cached Tokens | Number of tokens retrieved from cache |
Reasoning Tokens | Number of reasoning tokens |
Input Cost | Input cost ($) |
Output Cost | Output cost ($) |
Stream | Streaming mode status (True/False) |
Features | Enabled feature flags |
Application Name | Application name |
Error | Error message (displayed only when an error occurs) |
Error Type | Error type (api_error, program_error, etc.) |
TXID | Transaction ID |
Log Detail View
Click the Prompt column in the log list to open a transaction profile pop-out. You can view the full transaction details containing the LLM call.
- Transaction mode: Navigates to the full transaction view.
- Step mode: Opens the transaction view with the corresponding Step highlighted.
In the transaction profile, click an LLM HTTPC step to view the original prompt input/output, token/cost details, and GPU correlation analysis. For more details, see the LLM API Analysis document.
Merge Criteria Details
Transaction Merge
Merges all LLM calls within a single transaction (@txid) into one row.
- Prompt display: The input of the first Step and the output of the last Step are displayed.
- Tokens/Cost: The sum of all calls within the transaction is displayed.
- Model: The representative model of the transaction is displayed.
- Call Count / Error Count: The total call count and error call count are displayed.
Step Merge
Displays each individual LLM call (@step_id) as a separate row.
- Prompt display: The input (Input Message) and output (Output Message) of the corresponding Step are displayed.
- Tokens/Cost: Individual values for the call are displayed.
- Additional info: Details such as temperature, TTFT, and Stream status can be checked at the call level.
Entry from Other Menus
Prompt Log is frequently used when drilling down from other analysis menus.
| Entry Path | Description |
|---|---|
| Token Trend > Click time series chart | The time range for that point is automatically set and Prompt Log opens. |
| Token Trend > Click box plot model | The filter for that model is automatically applied and Prompt Log opens. |
Conversely, clicking the Prompt column in Prompt Log navigates to the transaction profile, where you can view all steps (DB, HTTP, LLM, etc.) within the transaction in chronological order.
Reference
Log Type
Prompt Log internally queries logs in the #LlmCallLog category.
| Log Type | Description |
|---|---|
llm_step_status | Final result of an individual LLM call (model, tokens, cost, performance, etc.) |
llm_tx_status | Transaction-level aggregated result (call count, error count, summed tokens/cost) |
system_message | System message (system role part of the prompt) |
input_message | Input message (user prompt) |
output_message | Output message (model response) |
tool | Tool call (Function calling) |
tool_result | Tool call result |