Lock tree
Home > Select Project > Analysis > Lock Tree
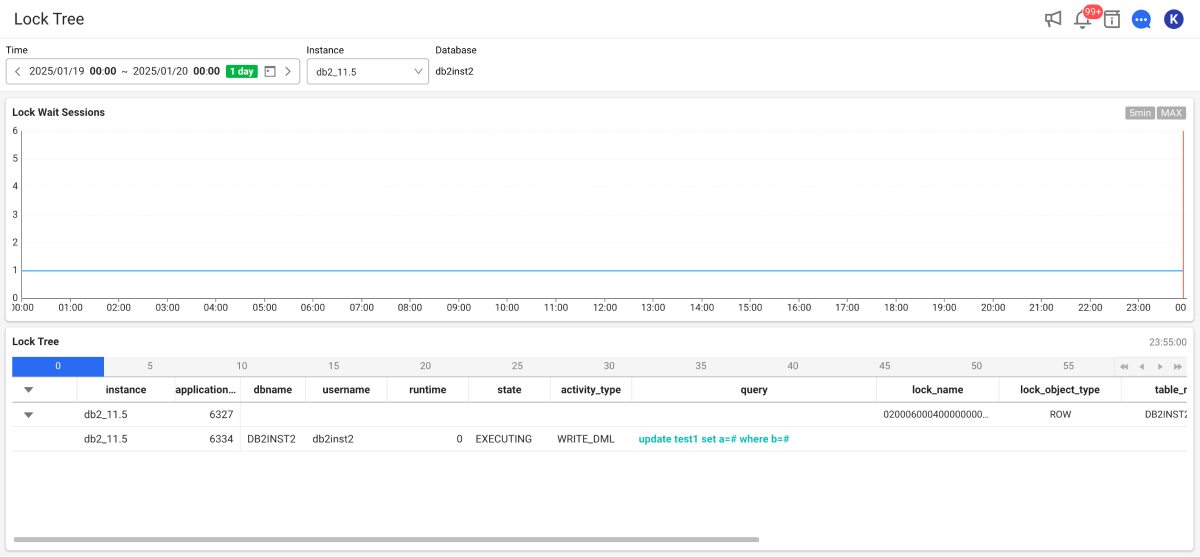
This tool analyzes the trend of locks that occurred during the day. This function allows you to visually check the tree structure of the session that generated the lock (lock holder) and the session waiting for the lock (lock waiter). You can analyze the relationship between the holder and waiter of the lock that occurred at a specific time point. Through the WhaTap's Lock Tree feature, the DB administrator can identify and resolve the DB lock issues and optimize the DB performance.
Key features are as follows:
-
Lock trend analysis: The trends of locks that occurred during the set search period are traced over time and displayed in a graph. This allows you to visually check how the locks are created and resolved.
-
Check lock holder and waiter: You can see the holder and waiter for each lock in a tree structure. Through this, when a specific lock occurs, you can check the relationship between the session that generated the lock and the waiting session.
-
Inter-session relationship analysis: By analyzing the relationship between the session that generated the lock and the waiting session, you can identify the cause of the lock that occurred during the query execution and transaction handling.
- Visual lock trend by time: Through the 1-Min Lock Trends and Lock Wait Sessions features, the lock occurrence data can be analyzed in time zones.
Basic usage guide
-
Select the date to view and set the time in Time at the top of the screen.
-
Select an instance to monitor.
You can check the lock that occurred during the set time on the selected instance.
If any lock occurs during the set period, you can analyze whether locks are concentrated in a specific time period or whether a specific session continuously causes locks in the Lock Wait Sessions graph and the table at the bottom.
- You can see the data in 5-second increments by dragging within 3 hours on the chart. However, the data in 5-second increments can only be viewed within the most recent month. The data earlier than one month can only be viewed as 5-minute summary data. For example, you can drag (drill down) lock tree data from 40 days ago for the 5-minute summary data, but you cannot see 5-second data.
Lock Wait Sessions
The Lock Wait Sessions feature allows you to analyze the lock wait sessions. Depending on the query period, the lock wait session data is provided at 5-minute intervals when the query is for 3 hours or more, and at 5-second intervals when the query is for less than 3 hours. You can also adjust the time range by dragging the chart flexibly.
1-Min Lock Trends
If you click a specific time zone in Lock Wait Sessions, the lock occurrence status for 30 minutes, from 15 minutes before to 15 minutes after is visualized. This allows you to effectively analyze the lock occurrence trend at 30-minute intervals.
Total Locks indicates the total number of locks generated in the time zone.
Viewing time
1-Min Lock Trends and Lock Tree tables are timed based on the maximum number of locks that occurred at the clicked time in Lock Wait Sessions. This allows you to find the zone with the most locks.

If you click the bar of a different time zone in the 1-Min Lock Trends chart with the Lock Wait Sessions unchanged, the time range is synced to the Lock Tree table by using the seconds with the highest number of locks for the minute. This allows you to see the information reflected in the Lock Tree table when changing the time zone.

-
Viewing for 3 hours or more (using 5-minute data)
The bar color of the 5-minute zone from the time of inquiry appears more prominent.
When the
07:15:00time point is clicked, the color of the07:15:00-07:20:00zone's bar chart appears more prominent.
-
Viewing for less than 3 hours (using 5-minute data)
It is useful for analyzing the locks that occur within short time intervals.

Column information guide
| Item | Description |
|---|---|
instance | Name of the DB2 instance (agent). |
application_handle | Unique handle value that identifies a specific application. |
dbname | Database name. |
username | User name of the current session. |
runtime | Time when the current session was run. |
state | Current state of the session. |
activity_type | Type of the operation running in the session. |
query | Content of the SQL query running in the session. |
lock_name | Unique ID of the lock. |
lock_object_type | Type of the object to which the lock was applied. |
table_name | Name of the table to which the lock was applied. |
holder_application_name | Name of the application with the lock. |
holder_member | ID of the member with the lock. |
waiter_application_name | Name of the application waiting for lock. |
waiter_member | ID of the member waiting for lock. |
wait_time | Lock waiting time. |
Analyzing with AI
Click the WhaTap AI button on the screen to open the WhaTap AI chat window, where the queried screen data is summarized and the analysis result is shown as a conversation. After reading the result, you can continue with follow-up questions in the same conversation.
-
The data used for the analysis is three sets: the trend for the whole query range, the 30-minute interval aggregation, and the lock tree snapshot at the selected point in time.
-
The analysis target is the data queried on the screen. If you change the query conditions and analyze again, the analysis is based on the changed data.
-
The conversation history is recorded in the
AI Analysis - {screen name}format.