AWS CloudWatch Exporter 설정
CloudWatch Exporter 사용 시 비용 안내
CloudWatch Exporter는 AWS CloudWatch API를 통해 메트릭을 조회하는 방식이므로, 조회되는 메트릭 수와 API 호출량에 따라 AWS CloudWatch 사용 요금이 발생할 수 있습니다. 요금은 CloudWatch의 메트릭, API 요청, 로그, 대시보드, 알람 등의 사용량 기준으로 부과되며, 자세한 내용은 AWS 공식 요금표를 참고하시기 바랍니다.
사전 준비
AWS 계정 요구사항
- AWS 계정 및 콘솔 접근 권한
- IAM 정책/사용자/역할(Role) 생성 권한
- CloudWatch 메트릭 읽기 권한
IAM 정책 생성
CloudWatch Exporter가 AWS CloudWatch API를 호출하기 위한 최소 권한 정책을 생성합니다. 이 정책은 아래 모든 인증 방식에서 공통으로 사용됩니다.
-
AWS Console에서 IAM → 정책 → 정책 생성으로 이동합니다.
-
JSON 탭 선택 후 아래 내용을 입력합니다.
노트아래는 예시 정책이며, 실제 사용하는 서비스의 권한만 포함하는 것을 권장합니다.
서비스 필요 권한 비고 EC2 ec2:DescribeInstancesEBS ec2:DescribeVolumesALB/NLB/CLB elasticloadbalancing:DescribeLoadBalancersALB/NLB Target Group elasticloadbalancing:DescribeTargetGroups,elasticloadbalancing:DescribeTargetHealth대상 그룹 상태 수집 시 필요 Auto Scaling Group autoscaling:DescribeAutoScalingGroupsRDS / Aurora rds:DescribeDBInstancesElastiCache elasticache:DescribeCacheClusters,elasticache:DescribeReplicationGroupsElastic Beanstalk elasticbeanstalk:DescribeEnvironments,elasticbeanstalk:DescribeEnvironmentHealthLambda lambda:ListFunctionsECS ecs:ListClusters,ecs:DescribeClustersS3 s3:ListAllMyBuckets{
"Version": "2012-10-17",
"Statement": [
{
"Sid": "CloudWatchReadPolicy",
"Effect": "Allow",
"Action": [
"cloudwatch:ListMetrics",
"cloudwatch:GetMetricStatistics",
"cloudwatch:GetMetricData"
],
"Resource": "*"
},
{
"Sid": "ResourceDiscoveryPolicy",
"Effect": "Allow",
"Action": [
"tag:GetResources",
"ec2:DescribeInstances",
"ec2:DescribeVolumes",
"elasticloadbalancing:DescribeLoadBalancers",
"elasticloadbalancing:DescribeTargetGroups",
"elasticloadbalancing:DescribeTargetHealth",
"autoscaling:DescribeAutoScalingGroups",
"rds:DescribeDBInstances",
"elasticache:DescribeCacheClusters",
"elasticache:DescribeReplicationGroups",
"elasticbeanstalk:DescribeEnvironments",
"elasticbeanstalk:DescribeEnvironmentHealth",
"lambda:ListFunctions",
"s3:ListAllMyBuckets",
"ecs:ListClusters",
"ecs:DescribeClusters"
],
"Resource": "*"
}
]
}팁tag:GetResources는aws_tag_select기능 사용 시 필요합니다. 태그 기반 필터링을 사용하지 않는다면 제거해도 됩니다.- 최소 권한 원칙(Least Privilege)에 따라 실제 모니터링 대상 서비스의 권한만 포함하는 것을 권장합니다.
-
정책 이름 입력(예:
CloudWatchExporterReadOnlyPolicy) 및 생성합니다.
인증 방식 선택
CloudWatch Exporter는 AWS SDK의 기본 자격 증명 체인(Default Credential Chain)을 사용하며, 다음 순서로 자격 증명을 탐색합니다. 실행 환경에 맞는 방식을 선택하세요.
환경 변수 → ~/.aws/credentials 파일 → EC2 인스턴스 프로파일(IMDS)
| 방식 | 실행 환경 | Access Key | 특징 |
|---|---|---|---|
| 방식 A: Access Key | 모든 환경 (온프레미스 포함) | 필요 | 설정 간단, 키 관리(유출·로테이션) 필요 |
| 방식 B: EC2 인스턴스 프로파일 | EC2 | 불필요 | 역할을 인스턴스에 직접 연결. EC2 실행 시 권장 |
방식 C: 인스턴스 프로파일 + role_arn | EC2 | 불필요 | 크로스 계정 수집, CloudWatch 권한을 별도 역할로 분리 |
config.yml의 role_arn은 "이 역할을 Assume하라"는 지시일 뿐, Assume을 수행할 기반 자격 증명은 별도로 필요합니다(방식 A의 키 또는 방식 B의 인스턴스 프로파일). role_arn만 단독으로는 동작하지 않습니다.
방식 A: Access Key 인증
IAM 사용자 생성
-
AWS Console에서 IAM > 사용자 > 사용자 생성으로 이동합니다.
-
사용자 이름을 입력하세요.
- 사용자 이름:
cloudwatch-exporter
- 사용자 이름:
-
권한 설정에서 직접 정책 연결으로 이동해
CloudWatchExporterReadOnlyPolicy을 선택합니다. -
사용자 생성을 완료합니다.
-
보안 자격 증명 탭에서 액세스 키를 만듭니다.
-
사용 사례로 AWS 외부에서 실행되는 애플리케이션을 선택합니다.
-
발급된 Access Key ID와 Secret Access Key를 저장합니다.
주의Secret Access Key는 이 화면에서만 확인할 수 있습니다. 반드시 안전한 곳에 저장하세요.
AWS Credentials 설정
CloudWatch Exporter가 AWS API에 접근하기 위한 인증 정보를 설정합니다.
방법 1. 환경 변수 방식
export AWS_ACCESS_KEY_ID="AKIAXXXXXXXXXXXXXXXX"
export AWS_SECRET_ACCESS_KEY="xxxxxxxxxxxxxxxxxxxxxxxxxxxxxxxxxxxxxxxx"
영구 적용을 위해 ~/.bashrc 또는 ~/.bash_profile에 추가합니다.
echo 'export AWS_ACCESS_KEY_ID="AKIAXXXXXXXXXXXXXXXX"' >> ~/.bashrc
echo 'export AWS_SECRET_ACCESS_KEY="xxxxxxxxxxxxxxxxxxxxxxxxxxxxxxxxxxxxxxxx"' >> ~/.bashrc
source ~/.bashrc
~/.bashrc에 자격 증명을 평문으로 저장하면 파일 접근 권한이 있는 모든 사용자에게 노출될 수 있습니다. 운영 환경은 방법 2(Credentials 파일 방식)를 권장합니다.
방법 2. AWS Credentials 파일 방식 (권장)
# 디렉토리 생성
mkdir -p ~/.aws

# credentials 파일 생성
cat <<EOF > ~/.aws/credentials
[default]
aws_access_key_id = AKIAXXXXXXXXXXXXXXXX
aws_secret_access_key = xxxxxxxxxxxxxxxxxxxxxxxxxxxxxxxxxxxxxxxx
EOF

# config 파일 생성
cat <<EOF > ~/.aws/config
[default]
output = json
EOF

# 권한 설정
chmod 600 ~/.aws/credentials
chmod 600 ~/.aws/config
방식 A는 config.yml에 별도 설정이 없습니다. Exporter가 환경 변수 또는 credentials 파일에서 자격 증명을 자동으로 탐색하며, config.yml에 Access Key를 넣는 옵션은 지원되지 않습니다.
방식 B: EC2 인스턴스 프로파일(Access Key 불필요)
역할을 EC2 인스턴스에 직접 연결하는 방식입니다. Access Key와 credentials 파일이 모두 필요 없으며, SDK가 인스턴스 메타데이터(IMDS)에서 임시 자격 증명을 자동으로 가져옵니다. 장기 자격 증명이 없어 키 유출·로테이션 부담이 없으며, AWS 보안 모범 사례에 부합합니다.
IAM 역할 생성
-
AWS Console에서 IAM > 역할 > 역할 생성으로 이동합니다.
-
신뢰할 수 있는 엔터티로 AWS 서비스 > EC2를 선택합니다.
- 신뢰 정책은 자동으로 아래와 같이 구성됩니다.
{
    "Version": "2012-10-17",
    "Statement": [
        {
            "Effect": "Allow",
            "Principal": { "Service": "ec2.amazonaws.com" },
            "Action": "sts:AssumeRole"
        }
    ]
} -
권한 정책에서
CloudWatchExporterReadOnlyPolicy를 선택합니다. -
역할 이름을 입력하고(예:
cloudwatch-exporter-role) 역할을 생성합니다.
EC2 인스턴스에 역할 연결
EC2 콘솔에서 인스턴스를 선택한 뒤 작업 > 보안 > IAM 역할 수정으로 이동해 생성한 역할을 선택하고 저장합니다.
역할 연결은 인스턴스 재부팅 없이 즉시 반영됩니다. 단, Exporter는 기동 시점에 자격 증명 체인을 탐색하므로 이미 실행 중이었다면 Exporter 재시작이 필요합니다.
연결 확인
# IMDSv2 토큰 발급 후 역할 연결 여부 확인
TOKEN=$(curl -sX PUT "http://169.254.169.254/latest/api/token" -H "X-aws-ec2-metadata-token-ttl-seconds: 60")
curl -s -H "X-aws-ec2-metadata-token: $TOKEN" http://169.254.169.254/latest/meta-data/iam/security-credentials/
# → 역할 이름이 출력되면 정상 (404면 미연결)

aws sts get-caller-identity
# → "Arn": "arn:aws:sts::<계정ID>:assumed-role/<역할이름>/..." 출력 확인
방식 B에서 config.yml에 role_arn을 넣지 않습니다. 인스턴스에 연결된 역할의 권한이 그대로 사용됩니다. 인스턴스에 연결한 역할과 동일한 역할을 role_arn에 지정하면 자기 자신을 Assume하려다 403 오류가 발생합니다.
방식 B도 config.yml에 별도 설정이 없습니다. 인스턴스에 연결된 역할의 자격 증명을 IMDS에서 자동으로 가져옵니다.
방식 C: 인스턴스 프로파일 + role_arn (AssumeRole)
인스턴스 역할은 최소 권한(sts:AssumeRole)만 두고, CloudWatch 읽기 권한은 별도 역할로 분리하는 방식입니다. config.yml의 role_arn에 다른 계정의 역할을 지정하면 크로스 계정 모니터링도 할 수 있습니다. 역할이 2개 필요합니다.
동작 구조
인스턴스 역할(IMDS) → sts:AssumeRole 호출 → 대상 역할의 임시 자격 증명 획득 → CloudWatch API 호출
| 역할 | 용도 | 연결 정책 |
|---|---|---|
인스턴스 역할 (예: cloudwatch-exporter-instance-role) | 인스턴스에 연결, Assume 수행 | sts:AssumeRole 권한만 |
대상 역할 (예: cloudwatch-read-role) | CloudWatch 읽기 | CloudWatchExporterReadOnlyPolicy |
인스턴스 역할 준비
방식 B와 동일하게 EC2용 역할(cloudwatch-exporter-instance-role)을 생성해 인스턴스에 연결하되, CloudWatch 정책 대신 아래 인라인 정책만 연결합니다.
{
    "Version": "2012-10-17",
    "Statement": [
        {
            "Effect": "Allow",
            "Action": "sts:AssumeRole",
            "Resource": "arn:aws:iam::<계정ID>:role/cloudwatch-read-role"
        }
    ]
}
대상 역할 생성
-
AWS Console에서 IAM > 역할 > 역할 생성으로 이동해 신뢰할 수 있는 엔터티로 AWS 계정을 선택합니다. 크로스 계정이면 해당 계정 ID를 입력합니다.
-
권한 정책에서
CloudWatchExporterReadOnlyPolicy를 연결합니다. -
역할 이름을 입력하고(예:
cloudwatch-read-role) 역할을 생성합니다. -
생성된 역할에서 신뢰 관계 탭으로 이동해 신뢰 정책을 편집하고, 인스턴스 역할을 Principal로 지정합니다.
{
    "Version": "2012-10-17",
    "Statement": [
        {
            "Effect": "Allow",
            "Principal": {
                "AWS": "arn:aws:iam::<계정ID>:role/cloudwatch-exporter-instance-role"
            },
            "Action": "sts:AssumeRole"
        }
    ]
} -
역할 요약 화면에서 IAM > 역할 > 역할 이름으로 이동해 ARN을 복사합니다. 이 값은 config.yml의
role_arn에 사용합니다.arn:aws:iam::<계정ID>:role/cloudwatch-read-role
양쪽 설정이 모두 필요합니다. 인스턴스 역할에 AssumeRole 권한이 없거나 대상 역할의 신뢰 정책에 인스턴스 역할이 없으면 is not authorized to perform: sts:AssumeRole 403 오류가 발생합니다.
AssumeRole 확인
aws sts assume-role \
  --role-arn arn:aws:iam::<계정ID>:role/cloudwatch-read-role \
  --role-session-name test
# 임시 자격 증명(AccessKeyId/SecretAccessKey/SessionToken)이 출력되면 정상
SDK가 임시 자격 증명(기본 1시간)을 자동 갱신하므로 별도 로테이션 작업이 필요 없습니다.
config.yml에 role_arn 설정
role_arn은 metrics 항목이 아닌 최상위 키로, 대상 역할 생성에서 복사한 대상 역할의 ARN을 지정합니다. 세 가지 인증 방식 중 config.yml에 설정이 필요한 것은 방식 C뿐입니다.
region: ap-northeast-2
role_arn: arn:aws:iam::<계정ID>:role/cloudwatch-read-role
# 크로스 계정 수집 시 다른 계정의 역할 ARN 지정 가능
metrics:
  - aws_namespace: AWS/EC2
    aws_metric_name: CPUUtilization
    aws_dimensions: [InstanceId]
    aws_statistics: [Average]
role_arn은 대상 역할(cloudwatch-read-role)의 ARN을 지정하세요. 인스턴스에 연결된 역할의 ARN을 지정하면 자기 자신을 Assume하려다 403 오류가 발생합니다.
Java 설치
CloudWatch Exporter는 Java 11 이상이 필요합니다. (참고. CloudWatch Exporter Github)
-
Amazon Linux 2 / CentOS / RHEL
# Amazon Corretto 11 설치 (Amazon Linux 2)
sudo yum install -y java-11-amazon-corretto-headless

# 또는 OpenJDK 11 설치
sudo yum install -y java-11-openjdk-headless -
Ubuntu / Debian
sudo apt update
sudo apt install -y openjdk-11-jre-headless
CloudWatch Exporter 설치
작업 디렉토리 생성
sudo mkdir -p /opt/cloudwatch-exporter
sudo chown $USER:$USER /opt/cloudwatch-exporter
cd /opt/cloudwatch-exporter
JAR 파일 다운로드
최신 버전은 GitHub Releases에서 확인할 수 있습니다.
# 최신 버전은 아래 GitHub Releases 페이지에서 확인 후 VERSION에 입력하세요.
# https://github.com/prometheus/cloudwatch_exporter/releases
VERSION="0.16.0"

# JAR 파일 다운로드
wget https://github.com/prometheus/cloudwatch_exporter/releases/download/v${VERSION}/cloudwatch_exporter-${VERSION}-jar-with-dependencies.jar

# 파일명 간소화를 위한 심볼릭 링크 생성
ln -sf cloudwatch_exporter-${VERSION}-jar-with-dependencies.jar cloudwatch_exporter.jar
최종 디렉토리 구조는 다음과 같습니다.
/opt/cloudwatch-exporter/
├── cloudwatch_exporter.jar              # 심볼릭 링크
├── cloudwatch_exporter-0.16.0-jar-with-dependencies.jar  # 실제 JAR 파일
└── config.yml                           # 설정 파일 (다음 섹션에서 생성)
설정 파일 작성(config.yml)
기존 Cloud 모니터링은 토글 버튼으로 수집을 활성화하지만, OpenMetrics 방식은 config.yml 파일을 직접 작성하여 수집 대상과 메트릭을 설정합니다.
주요 서비스별 메트릭 문서
S3 스토리지 메트릭은 일간(daily) 메트릭이므로 period_seconds를 86400(1일)으로 설정해야 합니다.
config.yml 기본 구조
필수 파라미터 설명
| 파라미터 | 설명 | 예시 |
|---|---|---|
region | AWS 리전 | ap-northeast-2 |
aws_namespace | AWS 서비스 네임스페이스 | AWS/EC2, AWS/RDS |
aws_metric_name | 수집할 메트릭 이름 | CPUUtilization |
aws_dimensions | 메트릭 분류 기준 | [InstanceId] |
aws_statistics | 통계 유형 | [Average, Maximum, Sum] |
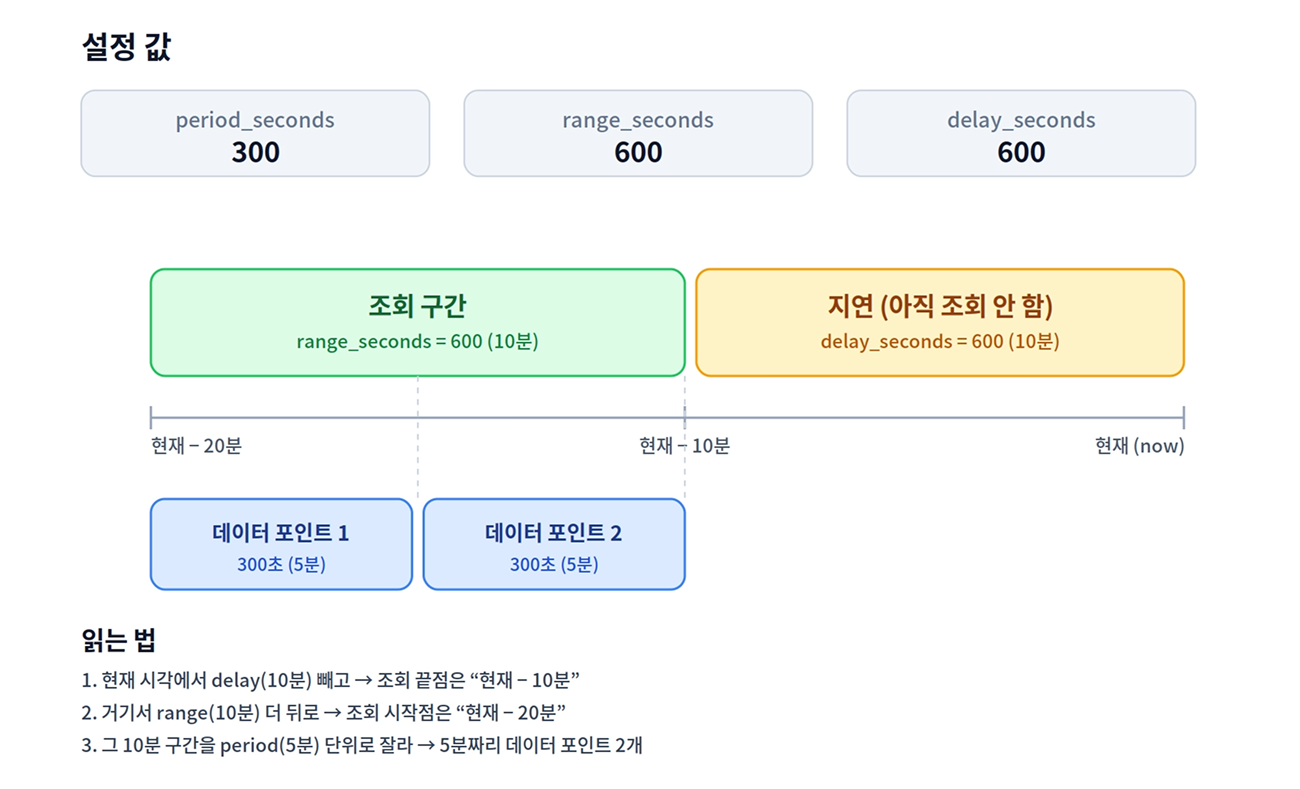
period_seconds | 데이터 포인트 간격 (초) | 300 (5분) |
range_seconds | 조회할 시간 범위 (초) | 600 (10분) |
delay_seconds | CloudWatch 데이터 지연 보정 (초) | 600 (10분) |
통계 유형(aws_statistics)
| 통계 | 설명 | 사용 예시 |
|---|---|---|
Average | 평균값 | CPU 사용률, 메모리 사용률 |
Sum | 합계 | 네트워크 트래픽, 요청 수 |
Maximum | 최대값 | 피크 CPU, 최대 지연시간 |
Minimum | 최소값 | 최소 여유 공간 |
SampleCount | 샘플 수 | 데이터 포인트 개수 |
전체 서비스 권장 설정
| 서비스 | period_seconds | range_seconds | delay_seconds |
|---|---|---|---|
| EC2 (기본 모니터링) | 300 | 600 | 600 |
| EC2 (상세 모니터링) | 60 | 300 | 120 |
| EBS Volume | 300 | 600 | 600 |
| RDS | 60 | 300 | 120 |
| Lambda | 60 | 300 | 120 |
| ELB / ALB / NLB | 60 | 300 | 120 |
| DynamoDB | 60 | 300 | 120 |
| CloudFront | 60 | 300 | 120 |
| ElastiCache | 60 | 300 | 120 |
| S3 (요청 메트릭) | 60 | 300 | 120 |
| S3 (스토리지 메트릭) | 86400 | 172800 | 600 |
| ECS | 60 | 300 | 120 |
| ECS/ContainerInsights | 60 | 300 | 120 |
| AutoScaling | 60 | 300 | 120 |
| ElasticBeanstalk | 60 | 300 | 120 |
값 정하는 공식
period_seconds= 해당 서비스의 게시 주기range_seconds≥period_seconds × 2(안전 마진, 보통 2 ~ 5배)delay_seconds≥period_seconds × 2
예외 / 주의사항
- EC2 기본 모니터링: 5분 단위가 기본입니다.
period_seconds를 60으로 줄여도 데이터는 5분에 한 번이라 빈 포인트만 양산됩니다. - EBS Volume: EC2와 동일하게 5분 단위입니다.
- S3 스토리지 메트릭: 하루 1회 게시됩니다.
period_seconds를 86400(1일)으로 두고delay_seconds도 충분히 길게 설정하십시오. - 커스텀 메트릭 (고해상도): 1초 단위가 가능하지만 비용 부담이 있습니다. 보통 60으로 충분합니다.
CloudWatch 데이터가 과거 시점인 이유
- 집계 구간이 끝나야 통계가 산출됩니다. 5분 평균은 그 5분이 모두 지나야 계산됩니다. 10:00 ~ 10:05 평균을 10:03에 조회하면 아직 구간이 끝나지 않아 값이 나오지 않습니다.
- 수집 지연을 피하기 위한 조회 지연 설정(
delay_seconds). CloudWatch는 메트릭이 API로 반영되기까지 수 분의 지연이 있습니다. 이를 피하려 OpenAgent는 일정 시간 이전의 데이터만 조회하도록 설정되어 있습니다. 현재 설정 기준 EC2·ALB·EBS는 약 10 ~ 15분 전, ElastiCache·ECS는 약 1 ~ 2분 전 데이터부터 안정적으로 조회됩니다. (서비스별period_seconds·delay_seconds설정에 따라 달라집니다.) - EC2 기본 모니터링은 5분 단위 게시. AWS 기본 제공 주기가 5분입니다. 상세 모니터링(유료)을 활성화하면 1분 단위로 수집됩니다.
config.yml 설정 예시
# config.yml 예시
region: ap-northeast-2               # AWS 리전
metrics:                             # 수집할 메트릭 목록
  - aws_namespace: AWS/EC2           # AWS 서비스 네임스페이스
    aws_metric_name: CPUUtilization  # 메트릭 이름
    aws_dimensions: [InstanceId]     # 디멘전 (분류 기준)
    aws_tag_select:                  # 태그 기반 필터링 및 레이블 추가
      resource_type_selection: "ec2:instance"  # 리소스 타입
      resource_id_dimension: InstanceId        # 디멘전과 매핑할 리소스 ID
    aws_statistics: [Average]        # 통계 유형
    period_seconds: 300              # 데이터 포인트 간격
    range_seconds: 600               # 조회 시간 범위
    delay_seconds: 600               # 데이터 지연 시간
role_arn 설정(AssumeRole)
CloudWatch Exporter를 실행하는 주체에는 최소 권한만 부여하고 CloudWatch 읽기 권한은 별도 역할로 분리하려면 config.yml에 role_arn을 지정합니다. 다른 계정의 역할 ARN을 지정하면 크로스 계정 수집도 가능합니다. role_arn은 metrics 항목의 하위 키가 아니라 최상위 키입니다.
region: ap-northeast-2
role_arn: arn:aws:iam::<ACCOUNT_ID>:role/cloudwatch-read-role
# 크로스 계정 수집 시 다른 계정의 역할 ARN 지정 가능
metrics:
  - aws_namespace: AWS/EC2
    aws_metric_name: CPUUtilization
    aws_dimensions: [InstanceId]
    aws_statistics: [Average]
role_arn은 지정한 역할을 Assume하라는 지시일 뿐이므로 단독으로는 동작하지 않습니다. Assume을 수행할 주체의 자격 증명이 함께 설정되어 있어야 합니다.
role_arn에는 CloudWatch 읽기 권한을 가진 대상 역할(예: cloudwatch-read-role)의 ARN을 지정하세요. EC2 인스턴스에 연결된 역할의 ARN을 지정하면 자기 자신을 Assume하려다 403 오류가 발생합니다.
고급 파라미터: 필터링
- aws_dimension_select (특정 리소스만 수집)
- aws_namespace: AWS/EC2
  aws_metric_name: CPUUtilization
  aws_dimensions: [InstanceId]
  aws_dimension_select:
    InstanceId:
      - i-xxxxxxxxxxxxxxxx1
      - i-xxxxxxxxxxxxxxxx2
  aws_statistics: [Average]
  period_seconds: 300
  range_seconds: 600
  delay_seconds: 600
- aws_dimension_select_regex (정규식 필터링)
- aws_namespace: AWS/EC2
  aws_metric_name: CPUUtilization
  aws_dimensions: [InstanceId]
  aws_dimension_select_regex:
    InstanceId: "^i-0123.*"
  aws_statistics: [Average]
  period_seconds: 300
  range_seconds: 600
  delay_seconds: 600
- aws_tag_select (태그 기반 필터링) - 권장
- aws_namespace: AWS/EC2
  aws_metric_name: CPUUtilization
  aws_dimensions: [InstanceId]
  aws_tag_select:
    tag_selections:
      Environment: ["production", "staging"]
      Team: ["devops"]
    resource_type_selection: "ec2:instance"
    resource_id_dimension: InstanceId
  aws_statistics: [Average]
  period_seconds: 300
  range_seconds: 600
  delay_seconds: 600
tag_selections에 키를 명시하면 해당 태그가 없는 리소스는 메트릭 수집 대상에서 제외됩니다. 수집이 누락되는 경우 대상 리소스에 해당 태그가 설정되어 있는지 먼저 확인하십시오.
| 서비스 | resource_type_selection | resource_id_dimension |
|---|---|---|
| EC2 | ec2:instance | InstanceId |
| ALB | elasticloadbalancing:loadbalancer/app | LoadBalancer |
| NLB | elasticloadbalancing:loadbalancer/net | LoadBalancer |
| CLB | elasticloadbalancing:loadbalancer | LoadBalancerName |
| RDS | rds:db | DBInstanceIdentifier |
| Aurora | rds:cluster | DBClusterIdentifier |
| EBS | ec2:volume | VolumeId |
| ElastiCache | elasticache:cluster | CacheClusterId |
CloudWatch Exporter 실행
nohup 실행(간단한 테스트용)
cd /opt/cloudwatch-exporter

# 백그라운드 실행
nohup java -jar cloudwatch_exporter.jar 9106 config.yml > cloudwatch_exporter.log 2>&1 &

# 프로세스 확인
ps aux | grep cloudwatch_exporter

# 로그 확인
tail -100f cloudwatch_exporter.log

# 종료
pkill -f cloudwatch_exporter.jar
Systemd 서비스 등록(운영 환경 권장)
방법 1: 환경변수 방식
sudo vi /etc/systemd/system/cloudwatch-exporter.service
[Unit]
Description=Prometheus CloudWatch Exporter
After=network-online.target

[Service]
Type=simple
WorkingDirectory=/opt/cloudwatch-exporter

# 환경 변수로 AWS Credentials 직접 설정
Environment="AWS_ACCESS_KEY_ID=AKIAXXXXXXXXXXXXXXXX"
Environment="AWS_SECRET_ACCESS_KEY=xxxxxxxxxxxxxxxxxxxxxxxxxxxxxxxxxxxxxxxx"

ExecStart=/usr/bin/java -jar /opt/cloudwatch-exporter/cloudwatch_exporter.jar 9106 /opt/cloudwatch-exporter/config.yml
Restart=always
RestartSec=5

[Install]
WantedBy=multi-user.target
방법 2: AWS Credentials 파일 방식
sudo vi /etc/systemd/system/cloudwatch-exporter.service
[Unit]
Description=Prometheus CloudWatch Exporter
After=network-online.target

[Service]
Type=simple
WorkingDirectory=/opt/cloudwatch-exporter

# AWS SDK가 $HOME/.aws/credentials 파일을 참조
# ex: /root/.aws/credentials 파일 사용
Environment="HOME=/root"

ExecStart=/usr/bin/java -jar /opt/cloudwatch-exporter/cloudwatch_exporter.jar 9106 /opt/cloudwatch-exporter/config.yml
Restart=always
RestartSec=5

[Install]
WantedBy=multi-user.target
서비스 시작
sudo systemctl daemon-reload
sudo systemctl start cloudwatch-exporter
sudo systemctl enable cloudwatch-exporter
sudo systemctl status cloudwatch-exporter
OpenAgent 다운로드 및 설정
모든 파일은 동일한 디렉토리에 위치해야 합니다.
## Example
/opt/whatap/openagent/
├── openagent          # Executable file
├── whatap.conf        # Configuration file
└── scrape_config.yaml # Scraping configuration file
디렉토리 이동 및 실행 파일 다운로드
mkdir -p /opt/whatap/openagent
cd /opt/whatap/openagent

## AMD64 (Intel/AMD 64-bit processor)
wget https://repo.whatap.io/openagent/latest/amd/openagent

## ARM64 (ARM processor in Linux environment)
## CAUTION: macOS Apple Silicon not supported
wget https://repo.whatap.io/openagent/latest/arm/openagent
실행 권한 설정
chmod +x openagent
scrape_config.yaml 생성
scrape_config.yaml 파일이 수정되면 OpenAgent가 자동으로 변경사항을 감지하고 설정을 다시 로드합니다. 별도의 재시작이 필요하지 않습니다.
중요. 스크랩 주기(interval)는 반드시 exporter의 period_seconds 이상으로 설정하세요.
interval ≥ period_seconds
CloudWatch는 period_seconds 간격으로만 새 데이터 포인트를 생성합니다. 그런데 CloudWatch Exporter는 스크랩 요청이 올 때마다 CloudWatch API를 실시간 호출하므로, interval을 period_seconds보다 짧게 설정하면 다음과 같습니다.
-
새 데이터 없음: 같은 타임스탬프의 같은 값을 중복 수집할 뿐입니다.
-
비용 증가: API 호출 수는 스크랩 횟수에 비례해 늘어납니다. interval을 절반으로 줄이면 CloudWatch API 요금이 2배가 됩니다.
exporter period_seconds | 권장 interval |
|---|---|
| 300 (EC2 기본 모니터링, EBS 등) | "300s" 이상 |
| 60 (RDS, ALB, EC2 상세 모니터링 등) | "60s" 이상 |
| 86400 (S3 스토리지 메트릭) | 짧게 둬도 무방하나 데이터는 하루 1회만 갱신 |
config.yml에 period가 다른 메트릭이 섞여 있다면 가장 짧은 period_seconds에 맞추면 됩니다.
#scrape_config.yaml
features:
  openAgent:
    enabled: true
    targets:
      - targetName: cloudwatch-exporter
        type: StaticEndpoints
        # Target is enabled by default (enabled: true), this can be omitted
        enabled: true
        endpoints:
          - address: "192.168.49.2:9106"
            path: "/metrics"
            scheme: "http"
            interval: "300s"   # ⚠️ exporter의 period_seconds(예: 300) 이상으로 설정
            metricRelabelConfigs:
              - source_labels: [__name__]
                regex: ".*"
                action: keep
기본 실행
./openagent standalone
백그라운드 실행
nohup ./openagent standalone > /dev/null 2>&1 &
로그 확인
tail -f logs/whatap-boot-{yyyymmdd}.log
프로세스 관리
# Check process
ps aux | grep openagent

# Terminate process
pkill openagent
StaticEndpoints 설정 요소
- targetName: 타겟의 이름 (식별용)
- type: 타겟 유형 ("StaticEndpoints")
- endpoints: 스크래핑할 엔드포인트 정의
address: 스크래핑할 대상 주소 (IP:PORT 또는 HOSTNAME:PORT)path: 메트릭 경로 (기본값: /metrics)scheme: 스크래핑 프로토콜 (http 또는 https, 기본값 http)interval: 스크래핑 간격 (기본값: 60s)metricRelabelConfigs: 스크래핑 후 메트릭 재라벨링 설정
메트릭 재라벨링 설정(metricRelabelConfigs)
OpenAgent는 프로메테우스의 metric_relabel_configs와 유사한 메트릭 재라벨링 기능을 지원합니다. 이 기능을 사용하면 스크래핑 후 메트릭을 필터링하거나 레이블을 변경할 수 있습니다.
재라벨링 설정 요소
- source_labels: 소스 레이블 목록 (배열)
- separator: 소스 레이블 값을 연결할 때 사용할 구분자 (기본값:
;) - target_label: 대상 레이블 (결과를 저장할 레이블)
- regex: 소스 레이블 값에 적용할 정규식
- replacement: 대체 값 (정규식 캡처 그룹 참조 가능, 예:
${1}) - action: 수행할 작업 (keep, drop, replace)
지원되는 작업(action)
- keep: 정규식과 일치하는 메트릭만 유지
- drop: 정규식과 일치하는 메트릭 제거
- replace: 대상 레이블의 값을 대체 값으로 변경
예제
1. 모든 메트릭 수집
metricRelabelConfigs:
  - source_labels: [__name__]
    regex: ".*"
    action: keep
2. 특정 메트릭만 유지
metricRelabelConfigs:
  - source_labels: [__name__]
    regex: "aws_ec2_cpuutilization_average"
    action: keep
3. 정규식을 사용한 메트릭 필터링
metricRelabelConfigs:
  - source_labels: [__name__]
    regex: "aws_ec2_(cpu|network).*"
    action: keep
4. 레이블 이름 변경
metricRelabelConfigs:
  - source_labels: [instance_id]
    target_label: ec2_instance_id
    replacement: "${1}"
    action: replace
5. 정적 레이블 추가
metricRelabelConfigs:
  - target_label: metric_src
    replacement: "whatap-open-agent"
    action: replace