Metrics
Home > Select Project >
Alert > Event Configuration > Metrics tab
You can view the complete list of all metrics-based events configured for the project. You can review, edit, or delete existing metrics events, or add new events as needed.
Default Options
-
Event Level: Indicates the severity of an event and is classified into three levels: Normal (Info), Warning (Warning), and Critical (Critical).
-
Inactive Agent Alert: Triggers an event when no data is received from the agent for the configured duration. Click the toggle button to turn it on or off.
-
Duplicate Agent Alert Suppression: If two or more agents with the same name run simultaneously, events are not triggered for the selected duration (30 seconds, 1 minute, 3 minutes, 5 minutes, 10 minutes).
-
Search: Search events by event name.
-
JSON Download/Upload: Edit event rules directly in the JSON editor, or download them as a file, modify them, and upload them again.
-
+ Add Event: Add a new metrics event.
-
Resize Columns: Adjust column widths by dragging column borders.
| Item | Description |
|---|---|
| No. | Event sequence number |
 | Event activation status - Enabled: An event is triggered when conditions are met - Disabled: The event does not run and conditions are not evaluated |
 | Edit or delete event settings |
| Event Name | User-defined event name - Up to 255 characters |
| Rule | Event trigger conditions |
| Target | Monitoring targets to which the event applies |
| Trigger Count | The time window and number of occurrences required to trigger an event - An event is triggered when conditions are met the configured number of times within the selected duration |
| Pause | Temporarily suppresses the same event after an alert is triggered - Available durations: Disabled, 5 min, 10 min, 15 min, 20 min, 30 min, 1 hr, 2 hrs, 3 hrs, 6 hrs, 12 hrs, 1 day - If recovery notifications are enabled, alerts are not triggered for the selected duration after a RECOVERED notification is sent |
| Recovery Notification | Whether to receive a RECOVERED (normal) notification when Critical or Warning events are resolved - Enabled: Sends a RECOVERED notification when the status changes from in progress to normal and allows viewing active and resolved states in event history - Disabled: Triggers a one-time event each time the threshold is exceeded |
| Event Recipients | Users or groups that receive notifications for the event (recipient tags) |
Event Configuration
Metrics events allow you to define events based on conditions that occur in monitored targets and configure notifications so you can respond efficiently.
Adding an Event with WhaTap AI
Describe the condition you want to be alerted on in plain language, and WhaTap AI builds a metrics event rule and proposes it in its response. You do not have to look up the metric name and threshold yourself.
The [ WhaTap AI ] button appears only in environments where WhaTap AI is available. For WhaTap AI configuration in on-premises environments, contact your engineer in charge.
-
Click the [ WhaTap AI ] button at the top of the screen.
-
Enter the condition you want to be alerted on.
I want a Critical alert when server disk usage exceeds 90%. -
Click the [ Apply ] button on the rule card in the response.
-
The event is registered only when you click the [ Apply ] button. Until then it remains a proposal.
-
To not register it, click the [ Cancel ] button.
-
-
Once registered, the card shows Applied along with the number of events created, and an [ Undo ] button appears.
- If the applied result differs from your intent, click the [ Undo ] button. The events created by this application are deleted and the state returns to what it was before.
When an event already monitors the same metric
WhaTap AI finds existing events that monitor the same metric and shows them in a list along with a note about possible duplication. Follow up to tell it whether to register a new event or modify and clean up the existing ones.
For how to use WhaTap AI and for question examples, see the Usage guide.
Add Event
To add a metrics event, go to Event Configuration > Metrics tab, then click the [ + Add Event ] button in the upper-right corner.
| How to Add a Metrics Event |
|---|
| Step 1. Select Template: Choose the basic structure of the event. |
| Step 2. Define Event Conditions: Configure the conditions that determine when the event is triggered. |
| Step 3. Select Event Target: Select the monitoring targets where the event applies. |
| Step 4. Basic Information and Notification Settings: Configure the event name, message, and recipients. |
Select Template
-
Depending on how you want to configure the event, select one of the three templates on the left side of the screen.
-
Create New: Freely configure categories and metrics from scratch. This option is suitable for advanced users who need complex conditions or fine-grained monitoring rules.
-
Quick Setup: Provides predefined categories, metrics, and default thresholds. You can apply it quickly by adjusting only the threshold values, which makes it suitable for beginners.
-
Advanced Setup: Add conditions or freely modify settings based on predefined categories and metrics.
-
Metrics events support multiple configuration approaches. The available templates may vary depending on the monitoring platform.
Define Event Conditions
In the Define Event Conditions step, configure the metrics that determine when the event is triggered, along with the trigger count, pause settings, recovery notifications, and event active time.
Metric Settings
-
Enter a category in the search field, or select a category (metric) from the category list.
You must select a category to proceed with metric configuration.- The category list shows the category name, data collection interval, and key. It displays metrics data collected in the project within the last 3 hours.
-
If the metric you need is not listed, select Direct Input and enter the category manually.
NoteIf you are not sure about categories or metrics, use the Metrics Finder.
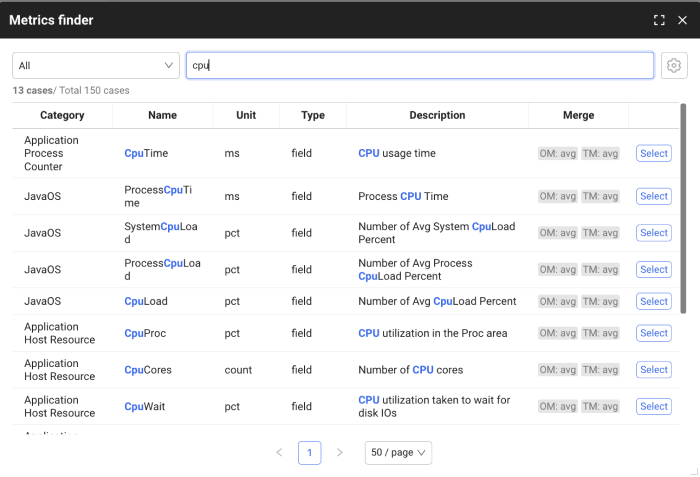
When configuring metrics for the first time, the Metrics Finder helps you locate metrics more quickly.
-
Search for a metric in the Metrics Finder to view related categories and detailed information.
-
Click the [ Select ] button for a metric in the search results to automatically apply the selected value to the event configuration screen.
-
-
Select the event level (Critical, Warning, Info). You can configure multiple levels for a single metric.
NoteEvent Level Behavior
Even when multiple conditions are satisfied, only the highest-priority level (Critical → Warning → Info) triggers an event. For details, see the Level Action Guide.
-
Event levels are classified as Critical (Critical), Warning (Warning), and Info (Info).
-
It is recommended to configure multiple levels for the same metric with stepwise thresholds.
-
-
Enter the field, operator, and value for the selected event level.
a. Click + Add to add more conditions.
&&: An event is triggered only when all conditions are satisfied simultaneously||: An event is triggered when at least one condition is satisfied
b. Click — to remove the condition.
NoteFor condition syntax and supported operators, refer to the Condition Settings Guide.
Trigger Count
Configure how many times a condition must be met before an event is triggered. This is useful for detecting persistent issues only.
-
Select the trigger frequency.
-
Consecutive: An event is triggered when the condition occurs consecutively for the configured number of times.
-
Recent: An event is triggered when the condition occurs the configured number of times within the selected time window.
- Available durations:
5 seconds,10 seconds,15 seconds,30 seconds,1 minute,2 minutes,3 minutes,4 minutes,5 minutes,10 minutes,30 minutes,1 hour
- Available durations:
-
-
Enter the trigger count.
- The Interval value corresponds to the data collection interval of the selected category. (Interval: 10s)
Pause
To prevent excessive event generation, select a pause duration for event execution. After an event occurs, the same event will not be triggered again during the configured time period.
- Available durations:
Disabled,5 minutes,10 minutes,15 minutes,20 minutes,30 minutes,1 hour,2 hours,3 hours,6 hours,12 hours,1 day
When recovery notifications are enabled
Even if the same event condition is met again, no notification is sent until the configured time has passed since the RECOVERED notification was received.
Resolved Notification
When the resolved notification feature is enabled, you can track state changes after an event occurs (in progress → resolved). The event is shown as an ongoing event in the Event History menu.
-
Resolved notifications apply only to Critical and Warning levels. Info-level events always operate as one-time events.
-
When a Critical or Warning event is resolved, a notification with the RECOVERED (normal) state is sent.
-
Click the toggle button to enable or disable this feature.
-
 Enabled: Events operate based on state. They enter an in-progress state when the threshold is exceeded and transition to a resolved state when the value recovers below the threshold.
 -
Disabled: A one-time event is generated each time the threshold is exceeded.
-
Event Operation Time
Configure tags so that events operate only during specific time periods (such as business hours, non-business hours, or maintenance windows). If no tag is configured, events operate continuously for 24 hours while enabled.
-
Click + Add.
-
In Event Operation Time, click + Create New Tag.
-
In Create Event Operation Time Tag, select the tag name, days, time, and color, then click the [ Apply ] button.
-
You can view created tags in the tag list, and apply them by selecting the checkbox.
-
To modify or delete a tag, click the
icon and update or delete it in Edit Event Operation Time Tag.
When a tag is deleted, it is removed from all users to whom it was applied. However, tags that are currently in use by event rules cannot be deleted.
Simulation
The simulation feature lets you pretest configured event conditions using historical data. If the expected number of events is too high or too low, you can adjust the conditions to find optimal threshold values.
- Rule Validation: Verify how newly created event rules would behave when applied to historical data.
- Threshold Tuning: Adjust thresholds to an appropriate level when events occur too frequently or not at all.
Start Simulation
- After completing event condition settings, click the [ Simulation ] button.
- Review the expected number of events and the visualized results.
Understanding Simulation Results

-
Time-Series Data
A graph displays metric changes over time along with threshold lines for each level, allowing you to intuitively identify when events are triggered.
-
Event Counts by Level
The number of events for the Critical, Warning, and Info levels is shown on the right side of the screen. This helps you understand overall event distribution and frequency.
-
Target-Level Details
Hover over a specific point on the chart to see the exact metric value and monitoring target at that moment. When multiple targets exist, they are distinguished by color. If patterns differ by target, you can use filtering to analyze them individually.
-
Peak Interval Identification
Identify periods where metrics spike sharply to understand when issues occur most frequently or to recognize recurring patterns.
Simulation Tips
-
Simulate Different Time Ranges
Run simulations for weekdays vs. weekends and peak vs. off-peak hours to set optimal thresholds for each time period.
-
Include Actual Incident Periods
Include past outage periods in simulations to verify whether current rules accurately detect real incidents.
-
Add Target Filtering
When many targets are monitored, simulation results can become complex. Use filters to focus on specific targets for clearer insights.
-
Adjust Thresholds Gradually
Instead of making large changes at once, adjust thresholds incrementally, such as in 10 percent steps, to find optimal values.
Select Event Target
If no event target is specified, events are triggered for all targets in the project, which can result in excessive events. It is therefore recommended to clearly define the targets to which the event applies.
If you change the event targets, the number of events may change. Click the Simulation button and run it again to check the updated expected event count.
Target Selection
You can specify the targets to which the event applies using either Select Input or Direct Input.
- Select Input
- Direct Input
-
Select or enter a tag, operator, and value.
a. If it is difficult to find a tag, you can search for it using the Metrics Finder. -
Click + Add to add event targets using conditions (
&&,||).
Enter the tag, operator, and value of the target to monitor directly.
- When you choose direct input, a list of available tags (Tag Select Input) is provided below the input field.
ex. endsWith(okindName, 'example_name') && container == 'prod.billing'
ex. ${4xxErrorType} == '401'
If you change the input method, any content you have entered will be reset.
Basic Information and Notification Settings
Configure the event name, message, and recipients. Because this information is displayed as is in event history and actual notification messages, it should be clear and easy to identify.
Event Activation
Configure whether the event is triggered when the defined conditions are met.
-
Enabled: The event is triggered when the configured conditions are satisfied.
-
Disabled: Conditions are not evaluated.
Event Name
Enter the event name to be used as the event title. The configured event name is displayed in the Event List and Event History menus and can be used as a search keyword.
Message
Enter the event message. The message you enter is used in event history and notifications. Click the  icon to view previously written message history. You can include variables in the message to insert actual values at the time the event occurs.
-
Variable Usage Rules
- Variable format:
${metric_name} - Only metrics within the same category as the configured category can be used as variables.
- You can combine multiple variables to create a more detailed message.
- The list of available variables can be found in the Metrics Query menu.
- Variable format:
-
Variable Usage Example
Event Configuration When Event Occurs Title Disk Usage Increase Disk Usage Increase Message Disk = ${disk}%Disk = 89.9%
Event Recipients
Specify the members who will receive event notifications.
- Receive All
- Receive by Tag Selection
Notifications are sent to all targets (members and channels) in the project that have event reception enabled.
Notifications are sent to project members who have the selected tag.
- Select Receive by Tag Selection.
- In the Reception Tag section, click the [ + Add Tag ] or [ + ] button.
- Under the Event Reception Tag window, click + Create New Tag.
- In the Create Tag window, enter a tag name, select a color, and click the [ Create Tag ] button.
- You can edit or delete created tags by clicking the icon in the tag list.
- In the Event Reception Tag window, select the desired tag from the Tag List to apply it.
Reception Tags
Reception tags are a feature for managing users or channels that receive notifications at a group level. When a reception tag is assigned to an event, notifications are delivered only to users associated with that tag. If no reception tag is set, notifications are sent to all users in the project.
Edit/Delete Event
-
Go to Alert Notifications > Event Settings and open the Metrics tab.
-
In the event list, click the
icon for the event you want to edit or delete. -
In the Edit Event Rule window, update the options and click the [ Save ] button.
a. To delete the selected event, click the [ Delete ] button in the upper-right corner of the Edit Event Rule window.
Event Sharing
You can save metric event settings as a JSON file to share configurations with other users or import settings created by others.
- JSON file name: event-rules-
YYYYMMDD.json
Export
- Click the [ JSON
 ] button at the top right of the screen.
 - When the JSON editor opens, click the [ Export ] button.
- If you use the export function after searching for events, only the searched list will be downloaded as a JSON file.
- After the JSON file is downloaded, share it with other users.
Import
- Click the [
 ] button at the top right of the screen.
 - Select the JSON file downloaded using the Export function.
- When the JSON editor opens, choose either [ Add to List ] or [ Overwrite ].
It is recommended to use this feature between projects of the same product type. You can import event settings from projects of different products, but they may not function correctly.
Edit in JSON Format
-
Click the [ JSON
] button at the top right of the screen. -
When the editor opens, modify the content according to the JSON format.
-
After completing the edits, click the [ Save ] button at the bottom of the screen.
If the modified content does not conform to the JSON format, an error message will be displayed at the bottom of the screen and the content cannot be saved. The error message may vary depending on the type of formatting issue.

{
    "version": 2,
    "eventId": "zcef7s7f27rum1",
    "enabled": true,
    "stateful": false,
    "title": "Active Transaction",
    "message": "Active Transaction = ${active_tx_count}",
    "category": "app_counter",
    "alertLabel": [
      "oid"
    ],
    "repeatCount": 1,
    "repeatDuration": 0,
    "silent": 300000,
    "receiver": [],
    "timeTag": [],
    "selectString": "",
    "conditions": [
      {
        "level": 20,
        "enabled": true,
        "rule": "active_tx_count > 100"
      }
    ],
    "createTime": 1763632674345,
    "lastModifiedTime": 1763632674347,
    "lastModifiedUser": "support@whatap.io",
    "basic": true,
    "metaId": "java004",
    "selectCondition": {
	    "oid": [
	       "-1010758404",
	       "-250906941"
	    ]
    }
  }
| JSON Field | Type | Description | Notes |
|---|---|---|---|
| version | Integer | Version of the event rule | Restricted |
| eventId | String | Unique identifier of the event rule | |
| enabled | boolean | Whether the event is enabled | |
| stateful | boolean | Whether the event is state-based | |
| title | String | Event rule name defined by the user | |
| message | String | Event rule message defined by the user | |
| category | String | Data category | |
| alertLabel | List<String> | Default identifier (primary key) value assigned per category for event state management | Restricted |
| repeatCount | Integer | Number of repetitions | |
| repeatDuration | Long | Duration for repetition | |
| silent | Integer | Pause duration | |
| receiver | List<String> | List of recipient tag keys | |
| timeTag | List<String> | List of operation-time tag keys | |
| selectString | String | Target selection | |
| conditions | List<Object> | List of trigger conditions by level | |
| ㄴ level | byte | Level value | Critical: 30, Warning: 20, Info: 10 |
| ㄴ enabled | boolean | Whether the level is enabled | |
| ㄴ rule | String | Trigger condition for the level | |
| createTime | Long | Initial creation time of the event rule | |
| lastModifiedTime | Long | Last modification time of the event rule | |
| lastModifiedUser | String | Account that last modified the event rule | |
| basic | boolean | Whether the event was created using Quick Setup | Restricted |
| metaId | String | Unique identifier of the Quick Setup template | Restricted: This value exists only for events created via Quick Setup (basic=true). |
| selectCondition | Object | Target selection value for Quick Setup | This value exists only for events created via Quick Setup (basic=true). |
Fields marked as “Restricted” may affect event behavior, so it is recommended not to modify their values.
Appendix
Trigger Conditions and Target Selection Guide
Metric alert trigger conditions and event target selection use the same syntax. However, trigger conditions use the field key as the variable, while target selection uses the tag key as the variable.
Level Behavior Guide
Event levels are categorized into Critical, Warning, and Info.
-
Priority-based Event Triggering
When multiple level conditions are met at the same time, only the event with the highest priority is triggered.
ExampleConfiguration:
- Warning: CPU > 70%
- Critical: CPU > 90%
Current state: CPU 95%
→ Result: Only the Critical event is triggered (Warning is suppressed) -
Level Escalation
For events that maintain an in-progress state, when a higher-level condition is met while a lower-level event is already in progress, both levels enter the in-progress state.
ExampleConfiguration:
- Warning: CPU > 70%
- Critical: CPU > 90%
Scenario:
1) CPU 80% → Warning triggered (in progress)
2) CPU 95% → Warning (in progress), Critical (in progress) -
Level De-escalation
For events with an in-progress state, when the level transitions from a higher level to a lower level, the higher-level event is resolved while the lower-level event remains active.
ExampleConfiguration:
- Warning: CPU > 70%
- Critical: CPU > 90%
Scenario:
1) CPU 97% → Critical triggered
2) CPU 85% → Critical resolved, Warning remains
3) CPU 65% → Warning resolved -
Execution Flow
- Warning: CPU > 70%
- Critical: CPU > 90%

Metric value: 60%   →    75%    →    92%    →    85%    →    60%
State:        Info        Warning      Critical       Warning       Info
                           (triggered)   (triggered)     (maintained)   (resolved)
                                           Warning
                                              (maintained)
Events that have an in-progress state remain active as long as their conditions are met and continue until those conditions are cleared.
Condition Configuration Guide
If a metric name starts with a number or contains special characters, you must wrap it in the ${metric_name} format.
- Brackets
( ),[ ] - Operators
+,-,*,/,% - Delimiters
:,@,#,,,(space) - Other special characters
!,^,&,|,~, ```,=
Examples using ${}:
${cpu(xos)} > 50
${mem[0]} >= 100
${cpu-usage} > 80
${namespace:cpu} > 70
${metric name} > 60
${4xx_error} > 10
Usable without ${}: Metric names that contain only alphabetic characters, underscores (_), or dots (.)
cpu > 80
cpu_usage > 50
CPUUtilization.Average > 0.8
-
Comparison Operators
Numeric ComparisonGreater than: cpu > 80
Greater than or equal: cpu >= 80
Less than: memory < 1000
Less than or equal: memory <= 1000
Equal to: status == 200
Not equal to: error != 0String Comparisonstatus == 'OK'
region == "us-east-1" -
Arithmetic Operators
-
Basic arithmetic operations
Addition:        cpu + 10 >= 90
Subtraction:     memory - 100 >= 500
Multiplication: cpu * 2 >= 100
Division:       disk / 1024 >= 100
Modulo: value % 10 == 0 -
Controlling precedence with parentheses
(cpu + memory) * 2 >= 200
(disk - used) / total >= 0.2
((cpu + memory) / 2) >= 50 -
Negative values
cpu > -100
-
-
Logical Operators
-
AND operator (&&)
cpu > 80 && memory > 1000
${cpu(xos)} > 50 && ${mem(xos)} > 60 -
OR operator (||)
cpu > 90 || memory > 90
disk < 10 || network > 1000 -
Combined logical operations
(cpu > 50 && memory > 50) || disk < 20
cpu > 80 && (memory > 1000 || disk > 500)
-
-
Pattern Matching Operators
-
LIKE operator
oname like 'prod-*'
url like '*error*'
message like 'WARN%' -
NOT LIKE operator
oname not like 'test-*'
url not like '*debug*'
-
-
Built-in Functions
-
Null check functions
isNull(value)             # Checks whether the value is null
isNotNull(value)          # Checks whether the value is not null
nvl(value, 0)             # Returns a default value if null
isEmpty(str)              # Checks whether the string is empty
isNotEmpty(str) # Checks whether the string is not empty -
Aggregate functions
sum(cpu, memory, disk)              # Sum
avg(cpu, memory)                    # Average
max(cpu, memory, disk)              # Maximum
min(cpu, memory, disk)              # Minimum
count(value1, value2, value3) # Count -
Math functions
round(cpu, 2) # Rounds to 2 decimal places -
String functions
length(str)                # String length
startsWith(str, 'prefix')  # Checks prefix
endsWith(str, 'suffix')    # Checks suffix
indexOf(str, 'search')     # String index
substring(str, 0, 10)      # Substring
trim(str)                  # Trims whitespace
replace(str, 'old', 'new') # String replacement
hasStr(str, 'search') # Checks string containment -
Conditional functions
- if: A conditional function that returns the
trueValueif the condition evaluates totrue, or thefalseValueif it evaluates tofalse
Syntaxif(condition, trueValue, falseValue)Exampleif(value >= 90, 'High', 'Medium') == 'High'- decode: Compares a value against conditions and returns the result of the matching condition, or a default value if no match is found
Syntaxdecode(value, condition1, result1, condition2, result2, ..., conditionN, resultN, defaultValue)Exampledecode(value, 1, 'Low', 2, 'Medium', 3, 'High', 'Unknown') == 'Unknown'- in: Returns
trueif the value matches any of the specified candidates; otherwise returnsfalse
Syntaxin(value, candidate1, candidate2, ..., candidateN)Examplein(status, 200, 201, 204) == false - if: A conditional function that returns the
CautionWriting Guidelines
-
Recommended
- Use simple variable names without
${}(e.g. cpu, memory) - Always use
${}when special characters are included - Use parentheses to clearly separate complex expressions
- Enter function names exactly as defined (case-sensitive)
- Use simple variable names without
-
Avoid
- Incomplete expressions (e.g.
cpu >,memory &&) - Mismatched parentheses (e.g.
(cpu > 80 && cpu > 70)) - Consecutive or invalid operators (e.g.
cpu >> 80,cpu >< 80)
- Incomplete expressions (e.g.
-