Analyzing the database
Home > Select Project > Analysis
It describes the database performance metrics that can be analyzed using the real-time monitoring.
Count trend
Home > Select Project > Analysis > Counts Trend
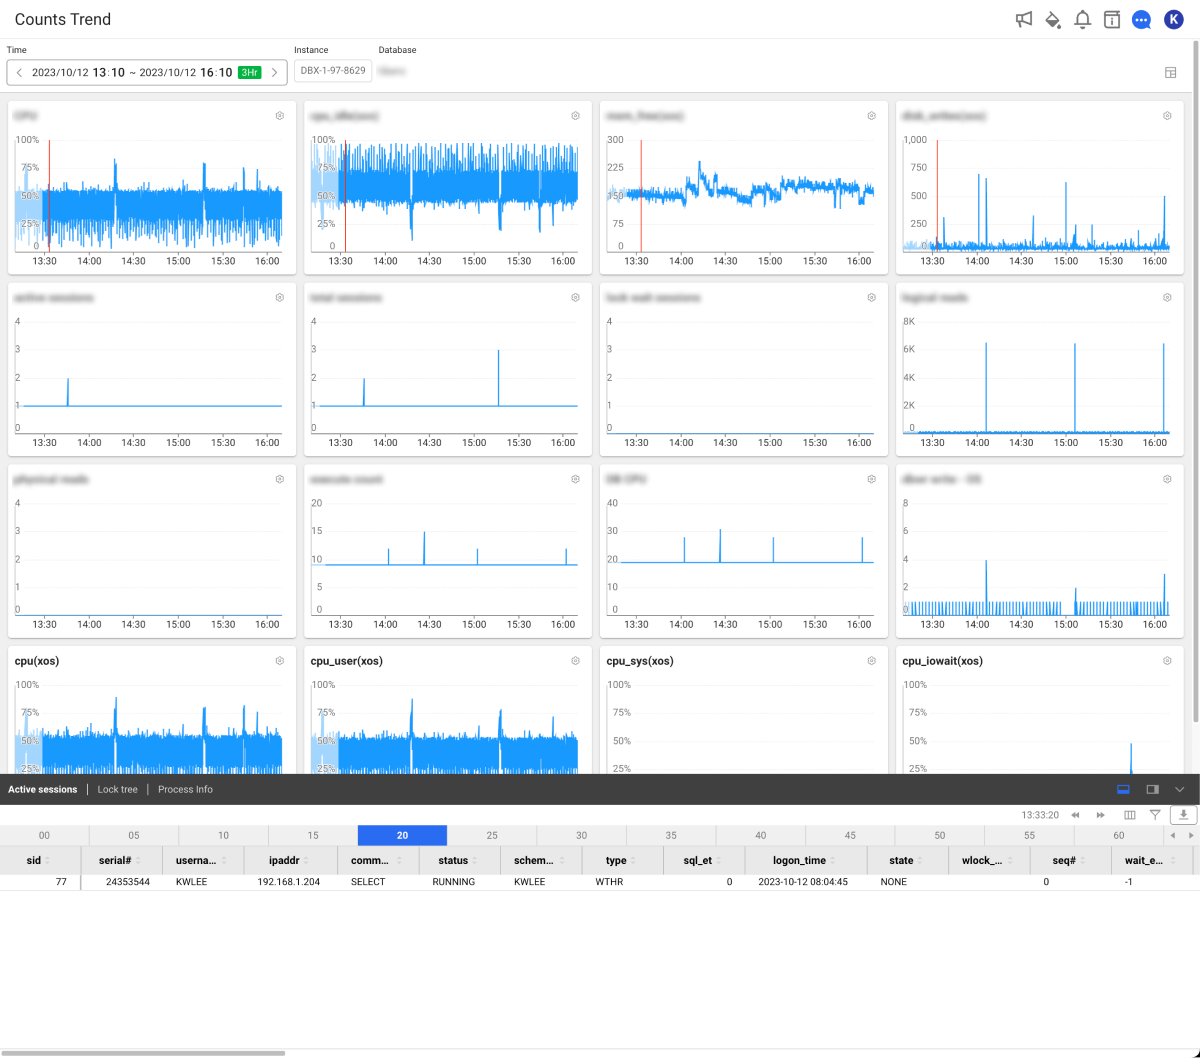
In Count Trend, you can check the following data.
-
Database running trend during the day
-
Key metrics for a specific time zone
-
Active Sessions
Select the Active Sessions tab at the bottom of the screen. Check information (including queries) of active sessions. For sessions running more than 10 seconds, they are displayed in yellow. For sessions running more than 20 seconds, they are displayed in red. You can see the query plans together.
-
Lock Tree
Select the Lock Tree tab at the bottom of the screen. You can see the lock information. The structure of holders and waiters is expressed in a tree form. A session lasting for more than 10 seconds is represented in yellow and a session lasting for more than 20 seconds is represented in red.
-
Process Info
Select the Process Info tab at the bottom of the screen. If you have installed the XOS agent, you can see the process information of the database server.
Comparison between count trends
Home > Select Project > Analysis > Counts Trend Comparison
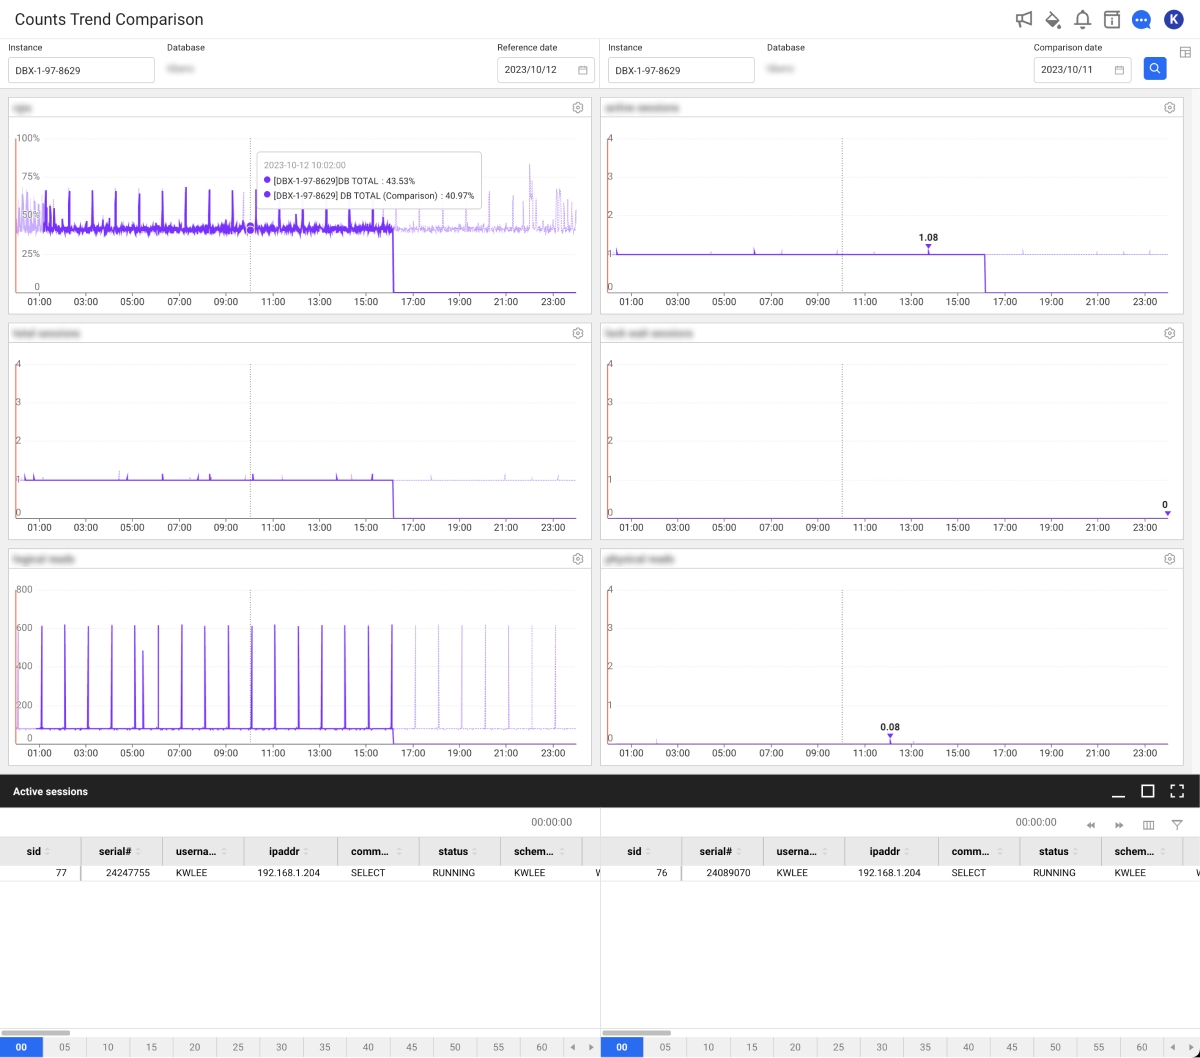
You can compare the count trends for different dates. After setting the reference date and comparison date, select ![]() .
.
Using the count trend chart
In the count trend chart, you can use the following functions.
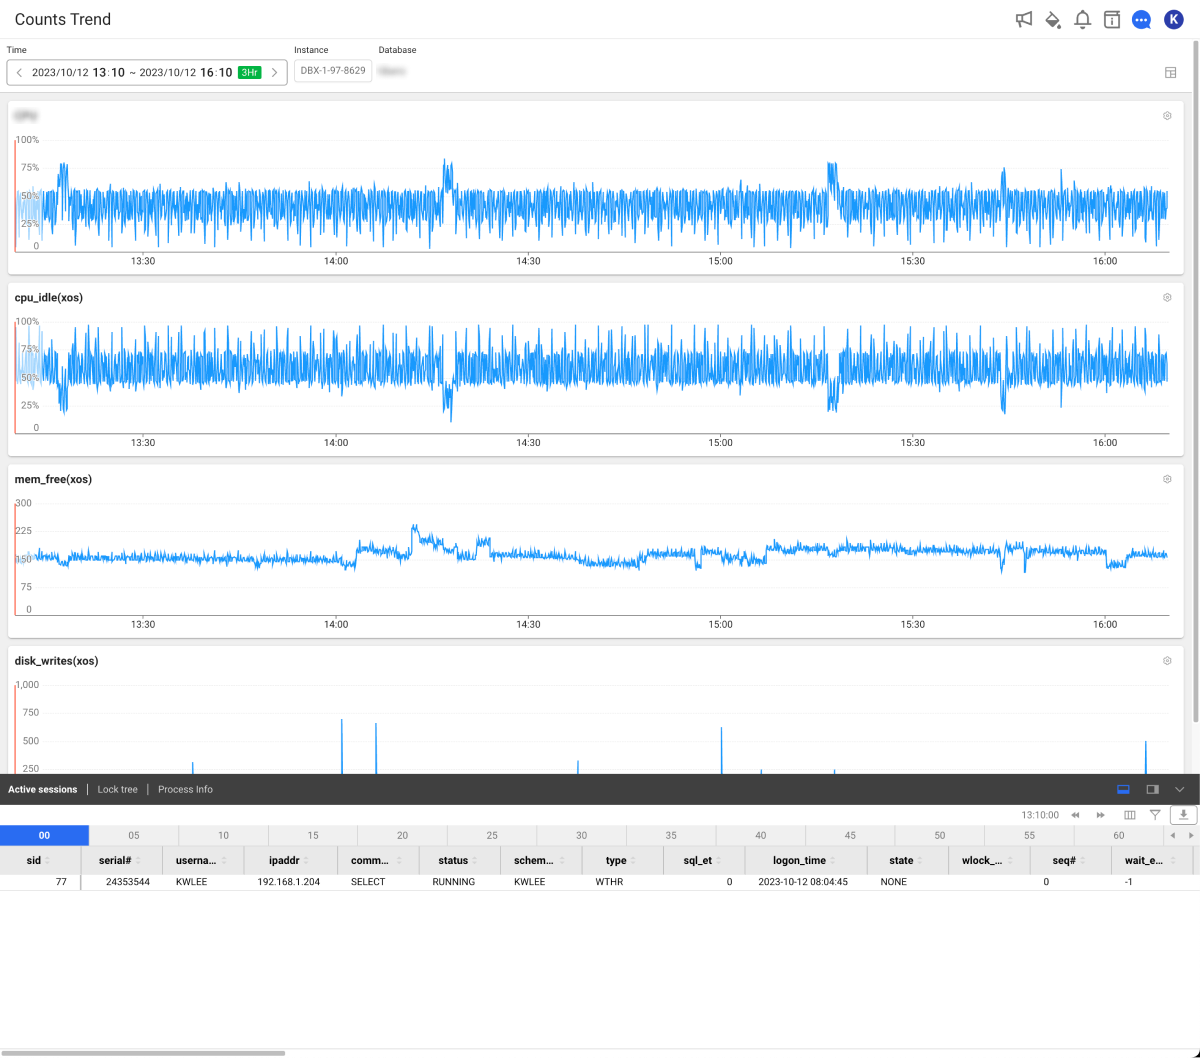
Select ![]() on the upper right of the screen. In the Layout Setting window, set it to 1 x 3 and then select Save. Time must be set to Last 24 hours. You can see the database key metrics in detail for the day, as follows:
on the upper right of the screen. In the Layout Setting window, set it to 1 x 3 and then select Save. Time must be set to Last 24 hours. You can see the database key metrics in detail for the day, as follows:
-
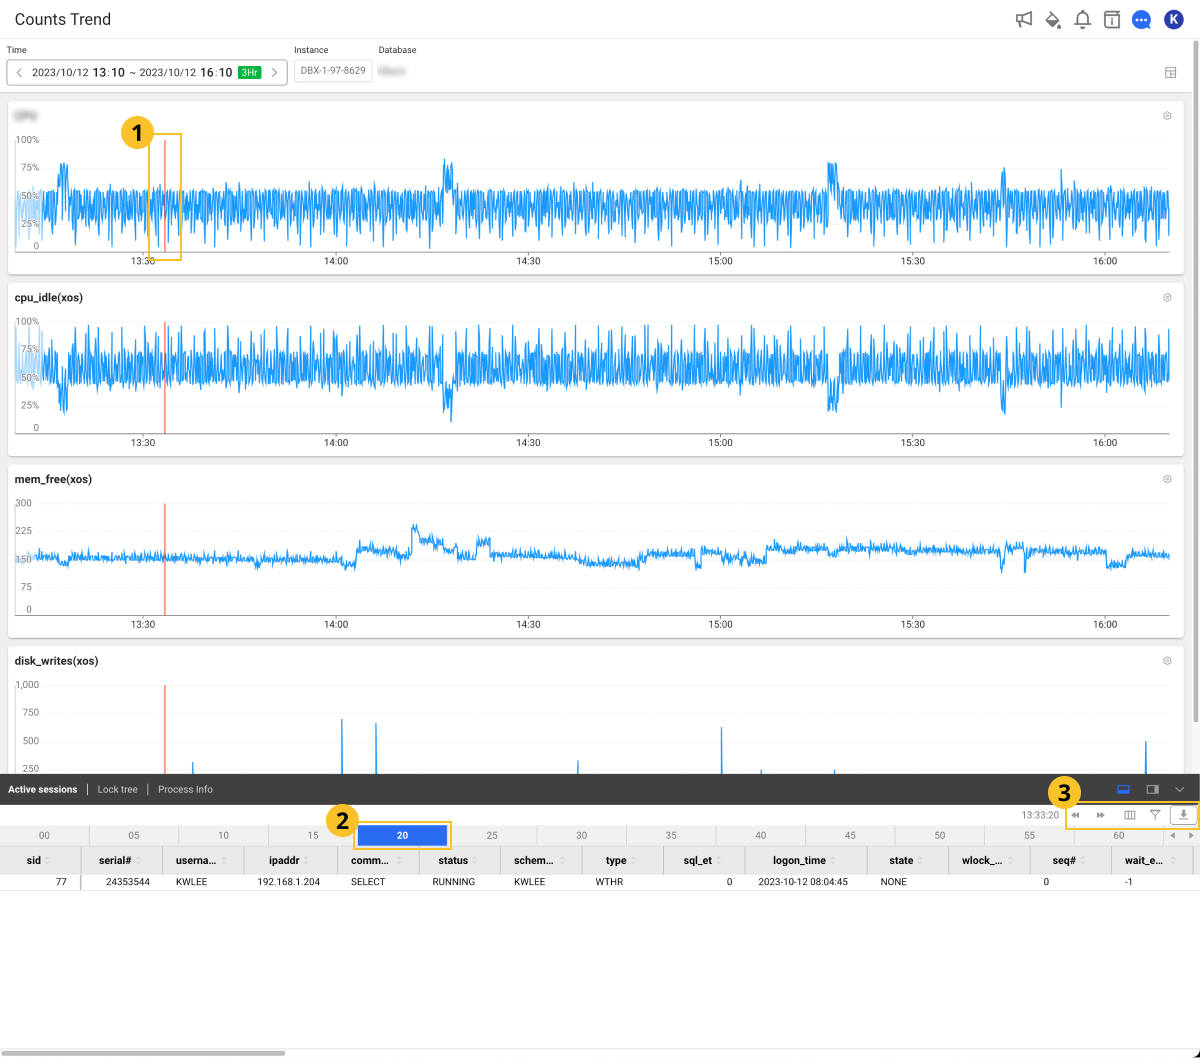
If you click a specific time point of the metrics chart, the (
 ) area appears with red lines and the collected active sessions can be also displayed.
 -
The active session data is collected every 5 seconds. You can search the data by selecting the
 1-second cells at the bottom of the screen.
 -
To move the time by 1 minute, select

 or
or  .
. -
To add or delete items in the detailed data cell, select
 . If the Column Setting window appears, you can add or delete any item.
 -
Select the
 button and then apply a filter to the data cell header to sort only the desired data.
 -
You can download the data displayed at the bottom of the screen as a CSV file. Select
 .
.
Lock tree
Home > Select Project > Analysis > Lock Tree
You can see the lock information. The structure of holders and waiters is expressed in a tree form. For more information about the lock tree analysis, see the following video clip.
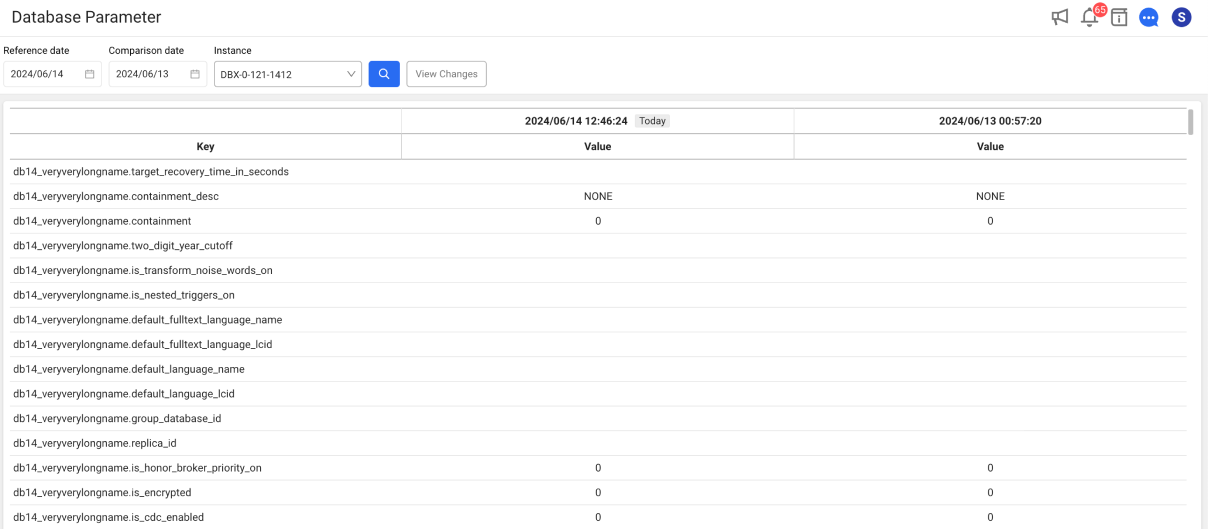
Database parameter
Home > Select Project > Analysis > Database Parameter
Using the database configuration inquiry, you can view the database settings of the past. You can compare parameter values in the database by date through the comparison function. By default, you can see the data of the current time.
If a problem occurs due to a parameter in the database, the cause can be quickly recognized through the database parameter comparison function.
-
Set values for Reference date and Comparison date.
-
Select a desired instance in Instance.
-
Click
 .
.
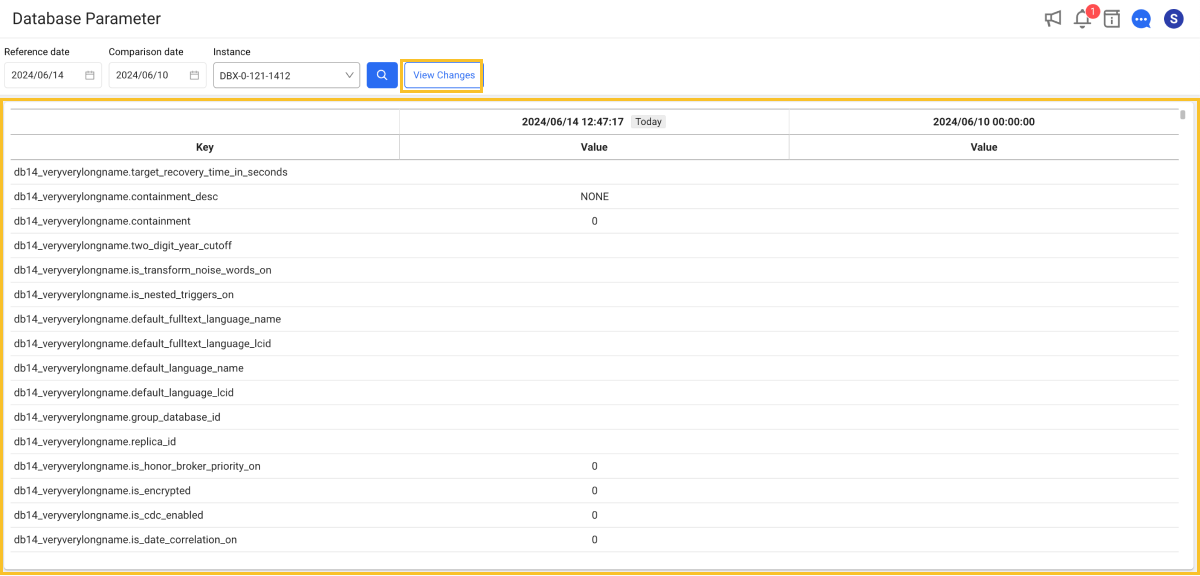
To check the changes between the current time and the selected past date at a glance, select View Changes.
Comparing database parameters for today
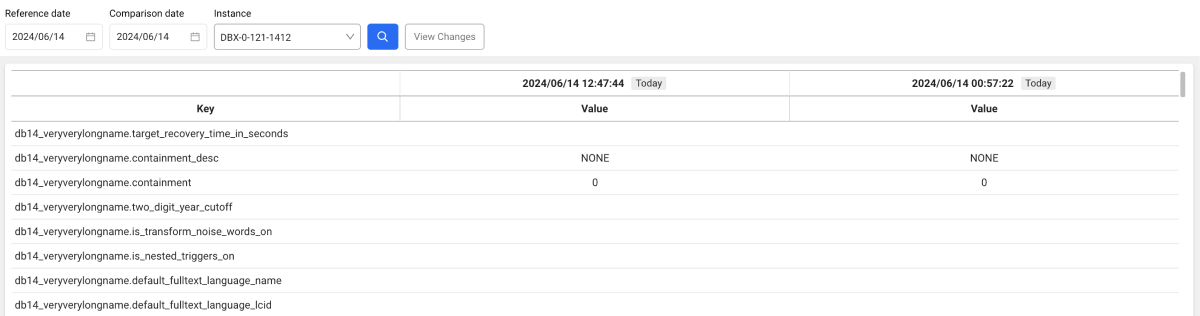
If you set both Reference date and Comparison date to the date for today, you can view and compare the real-time data and the last saved data. The storage time of the last data may differr depending on the database server environment.