WhaTap Monitoring services
Integrated Monitoring for multiple platforms
The purpose of WhaTap Monitoring is to share resources (human and material). The previous monitoring products require a separate collection servers and web screens for each monitoring target. However, WhaTap's Monitoring services share the data collection server while preserving the independence of services. For integrated management, the monitoring server must provide a flexible structure for expansion and multi-tenant functionality.
It can visualize business conditions in real time to identify problems quickly. Transactions are traced in real time to track any problems without reproduction. WhaTap Monitoring visualizes the IT service performance in a distributed environment in real time, to save time for problem recognition and enable preemptive responses.
Scopes of Monitoring
It covers almost all aspects of system monitoring through monitoring for applications, servers, databases, Kubernetes, clouds, logs, and URLs.
Application Monitoring
It provides application monitoring features such as Java, PHP, Node.js, Python, .NET, and Go. You can check the current active transactions running in real time.
It also monitors performance degradation issues in real time for the applications in complex and distributed business environments such as cloud, hybrid, and on-premise, to find the root cause quickly without reproduction. Any application problem can cause an increase of active transactions. If any problematic SQL query, HTTP call, or method is detected immediately at the moment of increase of transactions, you can find the problem faster along with analysis. With the monitoring, you can analyze the collected logs of transactions.
Server Monitoring
Even with more than 10,000 servers, Server Monitoring can collect the usage data for CPU, memory, IO, and such of all processes in seconds to analyze and report the momentary overload and performance degradation in real time. It provides automatic detection and notification of vulnerabilities that may occur in cloud applications, and helps easily predict and control the system size, which may differ monthly or weekly.
Kubernetes Monitoring
Kubernetes Monitoring provides a unified analytics from containers to applications. It monitors pods, worker nodes, and applications to analyze the impact to transaction performance for each item. In an MSA environment, you can trace the correlations among container level, service level, and transaction level, and visually check the call relationships between pods, containers, and services. It presents integrated matrix-trace-log information for observability. This enables quick root cause analysis and action when a problem occurs.
It also supports major platforms including EKS, AKS, GKE, OKE, Openshift, Cocktail, Accordion, and PaaS-TA.
WhaTap Labs obtained certifications from Cloud Native Computing Foundation (CNCF), Kubernetes Certified Service Provider (KCSP), and Cloud Service Security Certification (CSAP).
Database Monitoring
Database Monitoring can monitor database active sessions, running SQL, and the statistics and details of various metrics in real time, to select tuning targets and check whether they can be resolved or not. Through the views linked with applications, servers, and databases, you can check the DB status and analyze the root cause immediately when any service failure occurs. Through an efficient performance data collection structure, it is easy to analyze the data by providing a unified view after a quick collection even while monitoring multiple databases. Without any further installation, you can view and monitor the performance and failures of various databases at a glance in a cloud environment.
The provided products are as follows. Click a link to access the technical documentation.
URL Monitoring
From the user's point of view, URL Monitoring plays a monitoring role of the administrator who periodically checks the website for any problem. The displayed HTTP status codes allow you to monitor usage issues in real time and determine the access times for each location. It can check the status of services in major cities (6 countries) in North America, Europe, and Asia.
Browser Monitoring
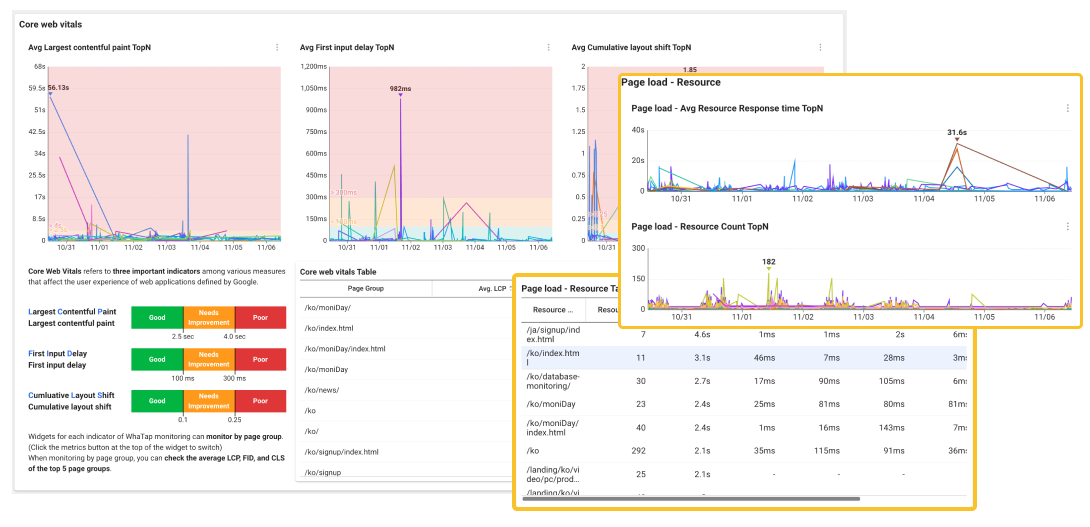
Browser Monitoring collects and analyzes various performance metrics such as page load time, server response time, resource loading time, and browser errors for browser applications. In addition, after identifying bottlenecks or performance issues in the browser applications, it helps provide the consistent, best performance to all users through optimization.
Network performance monitoring

The Network Performance Monitoring solution collects and visualizes network communication data for processes to identify any congestions and failures between networks and uses them to improve the network performance. It groups complex networks to quickly monitor the performance metrics for each section. Through the topology dashboard that allows you to quickly respond to network failures, you can quickly identify network failures by using the grouped and simplified network information.
Cloud Monitoring
Cloud Monitoring collects all metrics and cloud events in real time by connecting to the API of the cloud service provider. You can check the collected data through the dashboard and directly analyze the root causes of failures.
The provided products are as follows. Click a link to access the technical documentation.
Log Monitoring
With Log Monitoring, you can easily use various and numerous logs generated from complex systems (e.g. Cloud). The logs from hundreds or thousands of servers can be transferred to be checked in an integrated manner. You can search for logs flowing on the screen. For statistical purposes, you can categorize logs to see the count trend of them that occur in specific increments. You can explore the logs that are closely related to the time points of failures and resolutions, and can search for a large amount of logs under various conditions.
Features of WhaTap Monitoring
Real-time Monitoring Dashboard
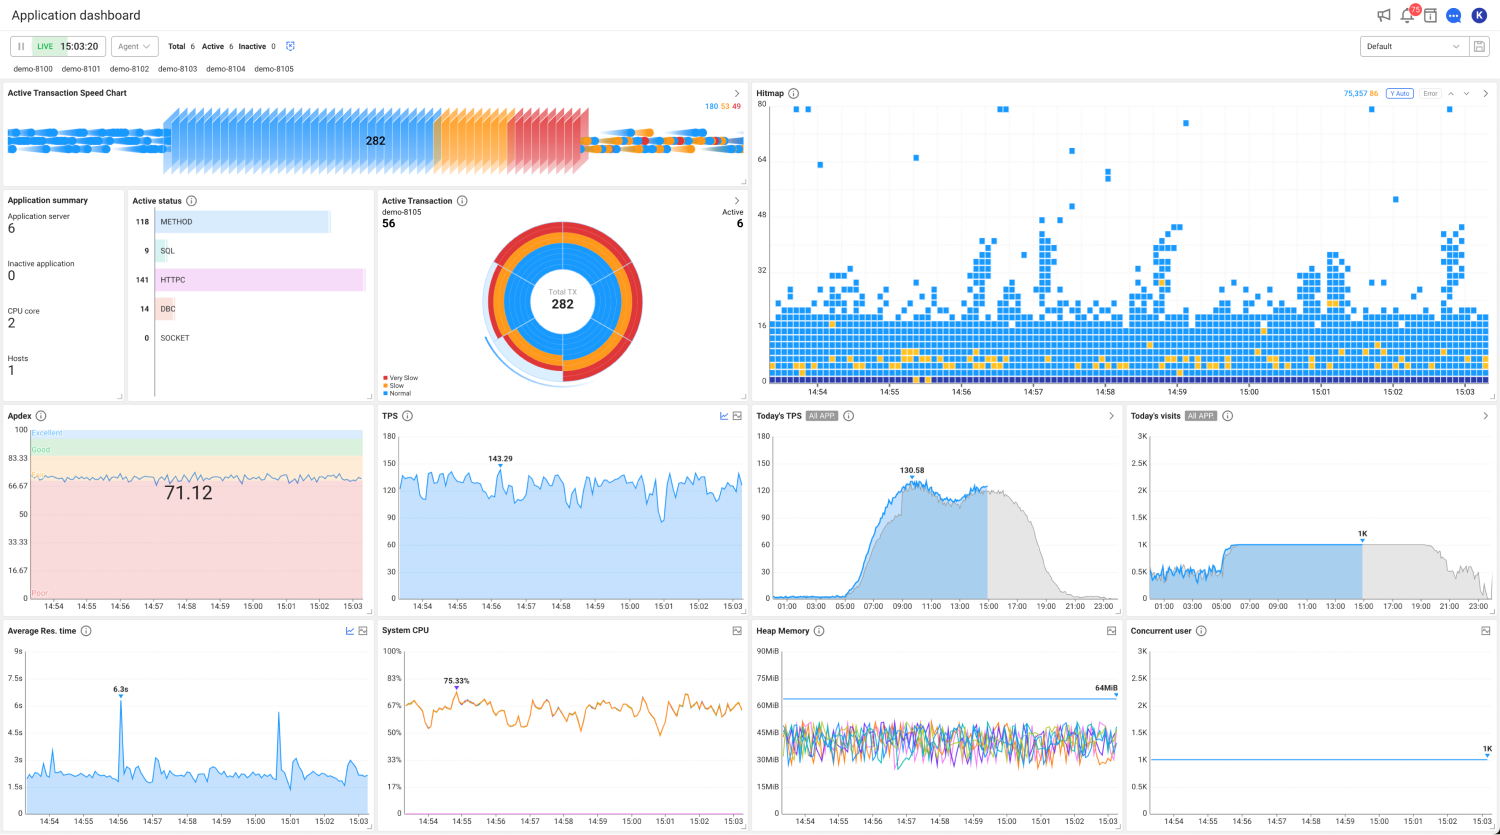
You can quickly recognize information and status of servers in real time on the chart-type dashboard. You can check and analyze the previous data for each metric. Through active transactions, you can find bottlenecks and troubleshoot them.
Support for channels that issue various notifications
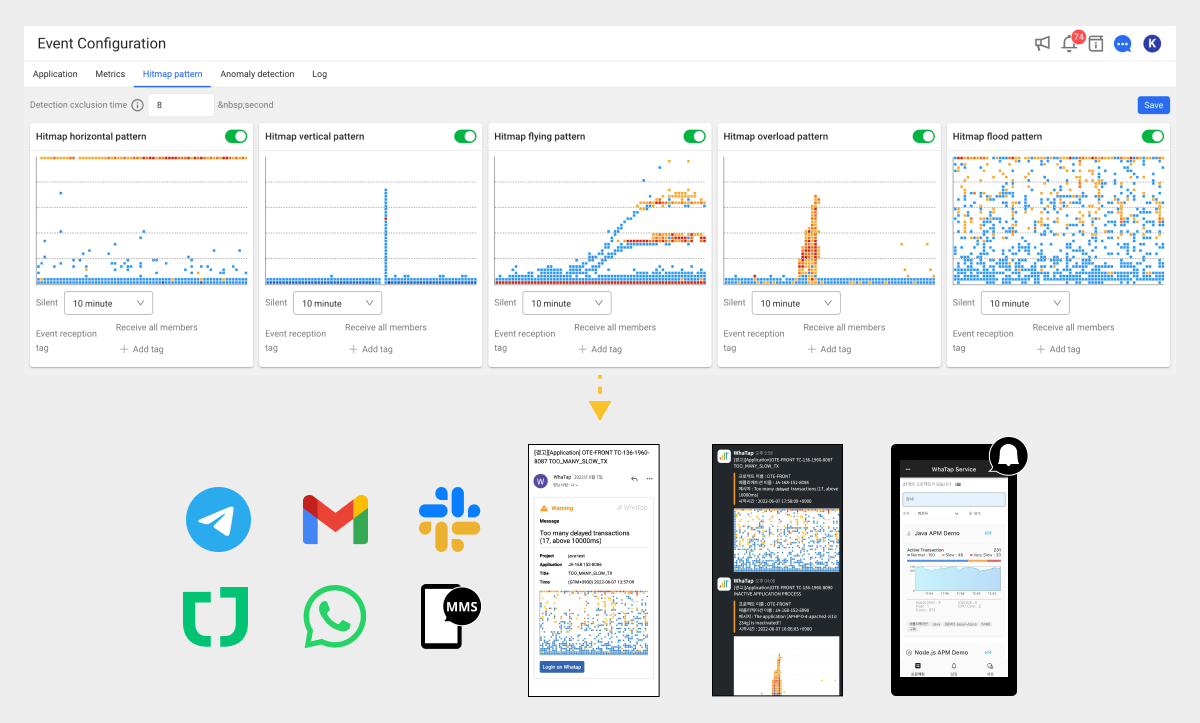
You can set event conditions and provide notifications through various channels such as Email, SMS, Messenger, and App Push. You can configure notification settings for communication loss of agents and collection servers, application resource utilization, active transactions, errors, response delays, and response distribution failures. In addition, through the machine learning-based AI notification settings, response distribution patterns are detected to send notifications.
For alerts, see the following to see the event types supported by monitoring platform.
Multi-region support for integrated monitoring
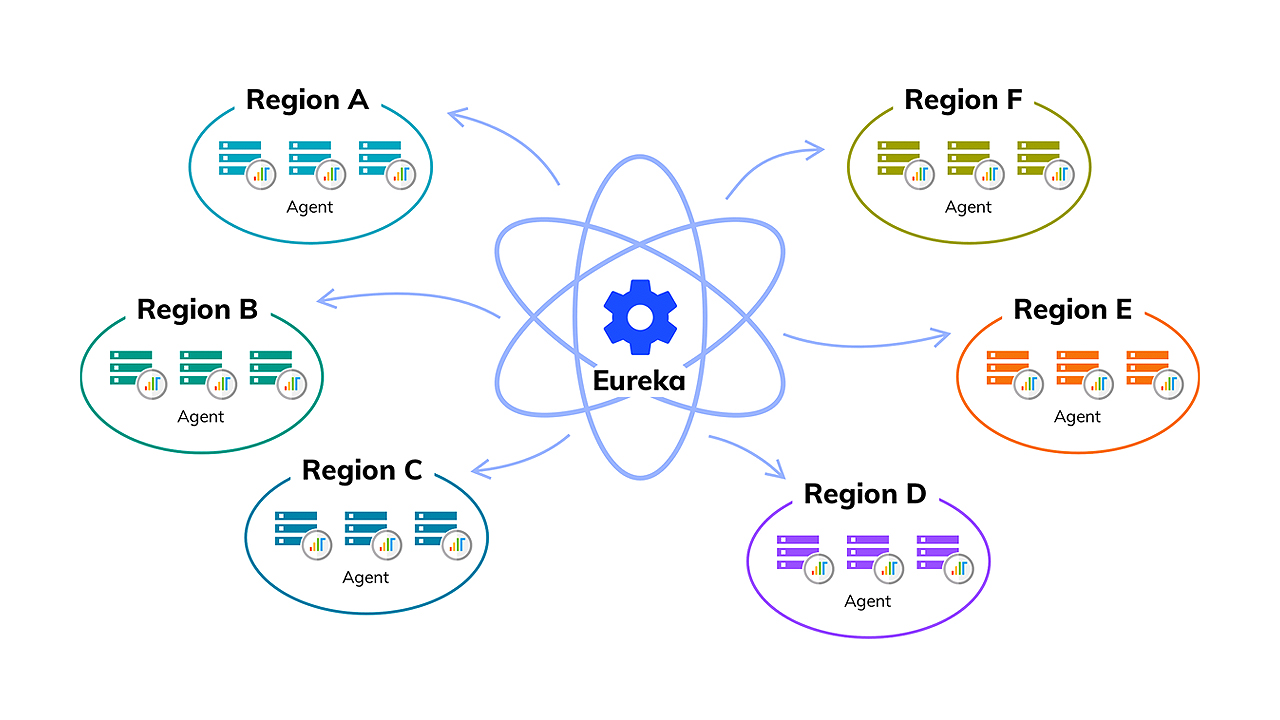
Each time a region is added, only a collection server is installed to monitor servers in multiple regions on a single monitoring screen in an integrated manner. WhaTap Monitoring can expand the collection server only by establishing additional IDC centers or cloud platforms.
Guaranteed stability and scalability of the collection server

Integrated monitoring is enabled only when server scalability is guaranteed. To accommodate the increased number of target servers to be monitored, internal scalability must be guaranteed. To ensure scalability, the WhaTap monitoring server consists of micro applications and maintain a distributed environment with low coupling. It also supports redundancy and data recovery to ensure data stability.
Collaboration and multi-tenant support

Through WhaTap Monitoring, the development team can use monitoring functions independently, and the operation team can use them in an integrated manner. In a single monitoring product, independence for each team or task is guaranteed, and the administrator in the center can control resources in an integrated manner. The administrator in the center does not directly access the development team projects, but the owners of each development team project access the authority.