Integrated Metrics Board
Home > Sitemap > Integrated Metrics Board
You can create a dashboard where you can view metrics data from all your projects. The metrics of different product groups can be seen at a glance by configuring them as widgets on the dashboard.
If you use Integrated Metrics Board for the first time, it is recommended to use Flex Board. For more information about Flex Board, see documents for each product.
Flex board documentation by product
Adding a widget chart
-
In Integrated Metrics Board, select + Add Widget.
-
A dashboard widget is created on the dashboard. Select
 on the upper right of the widget.
 -
The Create dashboard window appears.
Setting the series chart shape
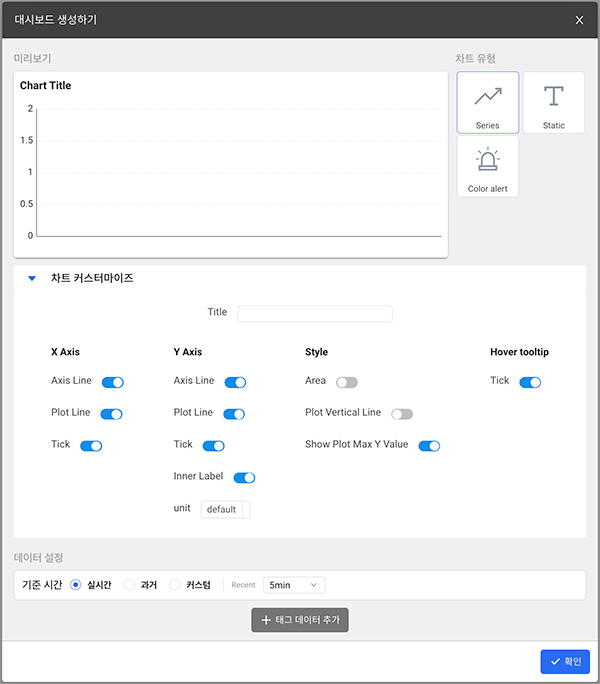
Select Series in Chart Type. In the series chart, you can see the flow of metric data over time.
-
Preview: You can see that the chart shape changes depending on the options.
-
Title: Enter the widget chart name.
-
X Axis
-
Axis Line: You can show or hide the X-axis line.
-
Plot Line: You can show or hide the vertical lines over time.
-
Tick: You can show or hide the X-axis text.
-
-
Y Axis
-
Axis Line: You can show or hide the Y-axis line.
-
Plot Line: You can show or hide the horizontal lines by data.
-
Tick: You can show or hide the Y-axis text.
-
Inner Label: Y-axis text is moved inside the chart.
-
uni: You can set the unit for the Y-axis data.
-
-
Style
-
Area: The inside of the graph area is filled with color.
-
Plot Vertical Line
-
Show Plot Max Y Value: It displays the highest number as text on the chart.
-
-
Hover tooltip
- Tick
Setting the shape of the static chart
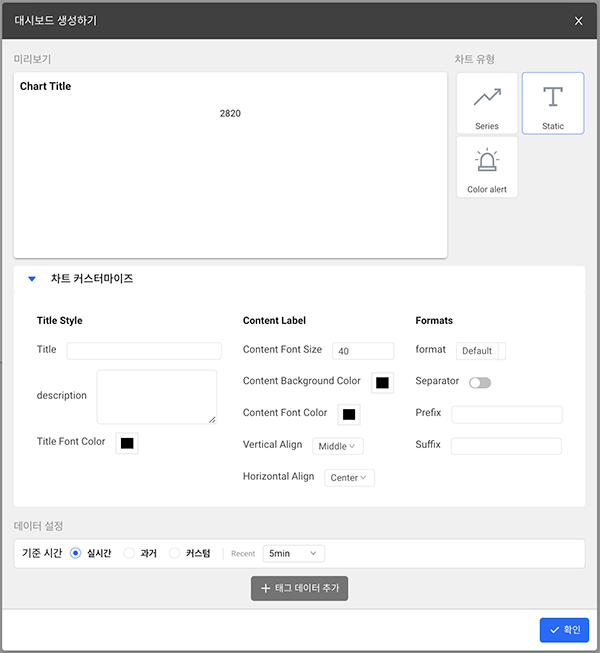
In Chart Type, select Static. The static chart represents metric data as text. It is convenient to immediately check the real-time data values.
-
Preview: You can see that the chart shape changes depending on the options.
-
Title Style
-
Title: Enter the title of the metric chart widget.
-
description: Enter the description of the metric chart widget.
-
Title Font Color: Set the color of the title.
-
-
Content Label
-
Content Font Size: Set the size of the text to display on the chart.
-
Content Background Color: Set the background color of the text to display on the chart.
-
Content Front Color: Set the color of the text to display on the chart.
-
Vertical Align: Set the text's vertical alignment.
-
Horizontal Align: Set the text's horizontal alignment.
-
-
Formats
-
format: Set the unit of the metric data.
-
Separator: Thousands can be separated with a comma (,).
-
Prefix: You can add a prefix to texts on the chart.
-
Suffix: You can add a suffix to texts on the chart.
-
Setting the shape of the color alert chart
Select Color alert in Chart Type. With the Color alert chart, you can easily see the delay interval of metric data. The intervals can be set in three steps by default, and can be subtracted or added.
-
Title: Enter the title of the chart.
-
Values
-
Name: You can enter names for each section to identify the current status.
-
Min: You can set the delay time in minutes.
-
Color: You can intuitively grasp the current status by setting colors for each delay section.
NoteTo delete an unnecessary step, select
 . To add a step, select + Add.
 -
Setting the reference time
Data Settings: Data appears on the chart based on the set time.
-
Real Time: You can check real-time data based on the last 5 minutes, 10 minutes, 30 minutes, 1 hour, 3 hours, 6 hours, and 12 hours.
-
Stat Past time: You can check the last 5-minute data based on today, yesterday, two days ago, three days ago, and a week ago. If you select Today, you can see 5-minute data based on the current time.
-
Custom: You can select the desired date and time.
Adding tag data
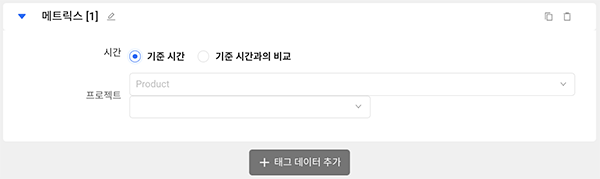
Select Add Tag Data and then select a project to import the metrics data.
-
You can rename the tag data by selecting
. -
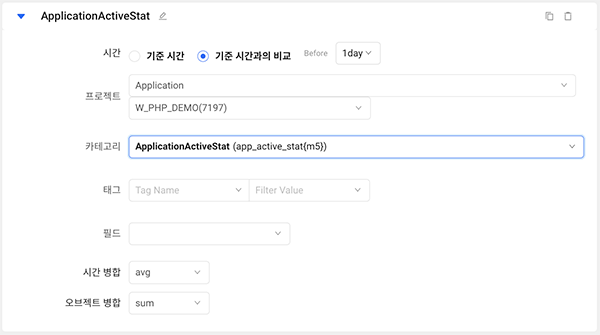
Time: You can load data and draw a chart based on the time set in Data Settings or set to draw a chart compared to the previous time.
-
Project: You can select a project by product. If you select a project, the Category item appears.
-
Category: Select a category to import metrics from the selected project. 카When a category is selected, the additional options appear.
-
Tag: You can select what to collect. You can select by agent aame (Oname), group (OkindName), host IP (Hostip), or type (Type).
-
Field: Select metrics to display in the chart.
-
Time Merge: The data with the same field values are merged at regular time intervals (5 minutes or 1 hour) depending on the time range.
-
Object Merge: Used to group data based on the value selected in the tag. This method merges data with matched tags among the data with different field values.
Once you have finished setting all items, select Complete.
-
Depending on the selected project, the items that can be selected in Category may differ.
-
For more information about metrics, see the following.
-
For more information about Time Merge and Object Merge, see the following.
Checking the widget chart
To check the metrics trend in real time after adding a widget chart, select View Mode at the top of the screen. To add, modify, or delete a widget chart, select Edit Mode.
Modifying a widget chart
To edit the widget chart, switch to Edit Mode and then select ![]() at the upper right of the widget chart. If the Create dashboard window appears, you can modify the desired items. After completion, select OK.
at the upper right of the widget chart. If the Create dashboard window appears, you can modify the desired items. After completion, select OK.
Copying a widget chart
You can copy a widget chart of the same type and then change only the metrics values. Switch to Edit Mode and then select ![]() on the upper right of the widget chart. To change the metrics, select
on the upper right of the widget chart. To change the metrics, select ![]() on the upper right of the widget chart, and then modify the desired items.
on the upper right of the widget chart, and then modify the desired items.
Deleting a widget chart
To delete any widget chart, switch to Edit Mode and then select ![]() on the upper right of the widget chart. If the pop-up window appears, select OK.
on the upper right of the widget chart. If the pop-up window appears, select OK.