Service 1.114.x
Service 1.114.12
December 21, 2023
Application
Fixed In Dashboard > Transaction map, fixed the bug where charts are not drawn in real-time mode if the user's PC time has been set older than the server time.
If there is a difference of more than 5 minutes between the server time and the user's PC time, correction may not be possible.
Database
DB V2
Fixed In Analysis > Counts trend comparison, fixed the problem where the table options do not appear correctly.
Service 1.114.11
December 19, 2023
Fixed In My usage > Payment information, fixed the problem where the USD currency is fixed for the customers who have selected the Credit card (Nicepay) payment method before the Service 1.104.17 (selection of country and billing currency added) release.
Service 1.114.10
December 18, 2023
Application
Feature In Dashboard > Application dashboard, added the option to also save the agent selection when saving the presets.
Service 1.114.9
December 12, 2023
Service 1.114.8
December 12, 2023
Service 1.114.7
December 8, 2023
Common
Dashboard
Fixed Fixed the issue where the chart on the Active Transaction Speed Chart widget does not appear when the browser screen size is decreased and then increased.
My usage
Fixed In Payment information, fixed the issue where the company registration number is initialized when the Bill to item is set.
Database
DB V2
Changed Modified to limit the data search range of the SQL Elapsed Map widget to 1 hour.
Service 1.114.6
December 7, 2023
Kubernetes
-
FixedIn Resource > Performance summary, fixed the data error in the following widgets:- Total Container CPU Request: Sum of CPU request (
cpu_request) values for all containers in the project - Total Container CPU Usage: Sum of CPU usage (
cpu_total_milli) values for all containers in the project - Total Container Memory Request: Sum of memory request (
mem_request) values for all containers in the project - Total Container Memory Usage: Sum of memory usage (
mem_working_set) values for all containers in the project
- Total Container CPU Request: Sum of CPU request (
-
FixedFixed the bug where you can move to a namespace project with no project viewing role in the following menus:- Resource > Namespace Status
- Management > Namespace management
-
ChangedIn APP > Multi service hitmap, modified the widget layout to a fixed one not to be moved.
Browser
Fixed In Dashboard > Browser Monitoring Dashboard, fixed the whiteout and browser freeze issues.
This occurs when you switch to another tab in the browser and then return to the current tab (Browser Monitoring Dashboard) after a certain period of time (about an hour).
Log
-
FixedIn Log search, fixed the filtering error. -
FixedIn Event configuration > Log, modified to initialize the previous values when the Filtering event targets item is changed from Typing to Selector while adding Real-time log event.
Service 1.114.5
December 5, 2023
Database
MongoDB / Redis
-
FixedIn Dashboard > Instance monitoring, fixed the issue where the metric name is not searched when the button on the widget is selected.
 -
FixedIn Dashboard > Instance list, fixed the issue that causes no response in the browser when viewing for a long time. -
ChangedIn Dashboard > Instance list, modified not to display the instances whose metrics are not viewed in the list.
Log
Fixed In Log search, fixed the issue where the items in the category list on the left are intermittently changed.
Service 1.114.4
December 1, 2023
Application
Feature In Analysis > Transaction Search, added the guidance message that the filters except Transaction ID cannot be applied while the Multi transaction ID filter is selected.
Server
Fixed In Server list > Server list, fixed the issue where the table lines are overlapped when enabling a specific column view.
Log
-
FixedIn Log search, fixed the issue where column heights in the table are intermittently calculated incorrectly. -
FixedIn Log search, fixed the issue where the data within the previous range is displayed if there is no data in the query range after the query time has been changed.
Service 1.114.3
November 28, 2023
Service 1.114.2
November 24, 2023
Common
Analysis
-
FixedIn the chart widget's detailed view of the Metrics Chart menu, fixed the issue where the Delete All Widgets button does not work. -
FixedIn Metrics Anomaly Detection, fixed the issue where the Delete All Widgets button does not work.
Stat/Report
Fixed In Report, modified to move to the guide (Docs) link depending on the set language when the Guide button is clicked.
Kubernetes
Fixed In the Container Map > View Detailed > Metrics tab of the namespace project, fixed the bug where the data of the Container memory total RSS by limit (%) widget does not appear.
Service 1.114.1
November 23, 2023
Log
Fixed In Live Tail, fixed the issue where the recommended list does not appear in the Filter field, when the Category item is All logs.
Service 1.114.0
November 22, 2023
Common
Flex board
-
FeatureAdded a UI to change exposure of table columns when an auxiliary table is set to the series type widget. -
FeatureAdded the chart types that can be selected by the Apdex widget. -
ChangedIf multiple projects are selected in the Hitmap widget on the unified Flex board, the function has been modified to expose the buttons for projects with any data in the Trace analysis window that appears when a chart is dragged. -
ChangedModified to display up to 2 decimal places, if the unit of number expressed in the secondary table is not set. -
FixedFixed the issue where content does not appear when the widget operates full screen in the Safari browser.
Maintenance plan
Feature Improved the Management > Maintenance plan menu.
-
Added a new maintenance plan menu. Select View New Version for the new maintenance plan function.
-
Added the Target agent option to add maintenance plans for each agent.
-
The Repeat option is also available in server projects.
For more information about a new maintenance plan, see the following.
Metrics Search
Changed Changed the chart data displayed with the Show chart function in the Fields column on the viewed data basis.
Alert
Feature In Alert > Event history, supported to search the message field other than the title.
My usage
-
FeatureIn Invoice Preview History, added the option to hide the usage and improved the price display function. -
FixedIn Project Subscription Status, fixed the whiteout that occurs when the data isnull. -
FixedIn Payment information, modified the promotion click area. -
FixedIn Payment information, deleted the contact input field when modifying the Bill to item (the contact information of Payment method is duplicated).
User Interface
-
FixedFixed the issue where the style of the QR code area is broken when the browser size is smaller than a certain pixel during multi-factor authentication in Manage account INFO.. -
FixedImproved visibility of the table displayed when the Group by option is enabled in Real-time alert list. -
FixedFixed the issue where part of the URL project card is cut off when Project list is set to Compact card view.
Application
Application dashboard
-
ChangedModified to sort the agent selection list by name. -
ChangedModified the colors of each item on the list displayed when By kind or By server is selected from the agent selection options. -
ChangedChanged the modal image of the dashboard guide.
Analysis
FixedIn Stack, fixed the bug where any filter is not applied when the agent selected in Unique stack does not exist.
Server
Dashboard
FixedIn Resource board, fixed the issue where the layout of several charts are distorted when the Alert status menu is displayed.
Server list
-
ChangedIn Server Detail, modified to always display the Limits table when viewing the Linux process details. -
ChangedIn Server Detail, when viewing the Process table details, modified the Disk I/O (Bps) chart to display the sum chart lines together. -
FixedIn Server list, fixed the issue where the scroll position is reset when enabling the Compare option and then checking the checkbox of the server to be compared. -
FixedIn Server Detail, modified to display the time-series chart's unit fromdaytoMM/DDinstead ofHH:MM. -
FixedIn Server Detail, fixed the issue where the maximum value of the Process table is intermittently displayed wrong.
Alert
-
FeatureIn Event configuration, added the Event reception tag option in the server/process event. -
ChangedIn Event configuration, modified to change the name of the default alert and to display thedefaulttag separately. -
FixedIn Event configuration, modified to reflect the actual event when adding or modifying the Server and Process events while the duration of the issuance condition has been set to 0 minute.
Database
Common
-
FeatureIn Stat/Report > SQL statistics, added the function to display the detailed statistical data for 5 minutes when the bar graph is clicked.InfoFor more information about the detailed statistical data window, see the following.
-
FeatureIn Dashboard > Instance monitoring and Multiple instance monitoring, added the button to fold the Active sessions button. Now the graph chart can be viewed in a wider screen. -
FixedIn Dashboard > Instance monitoring and Multiple instance monitoring, modified to view the data when the table tab is clicked at the bottom of the screen. -
FixedIn Dashboard > Multiple instance monitoring, modified the order of instances displayed in the equalizer chart to match the instance tags in the option bar on the screen. -
FeatureEnhanced the UI of the SQL details screen for user convenience.-
Enhanced the query and plan lookup areas to be moved horizontally and vertically.
-
Changed the parameter bind to be performed by default.
InfoFor more information, see the following.
-
PostgreSQL
-
FeatureAdded the function to view the plan information in json format. -
FeatureAdded a new menu,V2Analysis > Top Object.InfoFor more information about Top Object, see the following.
-
FeatureInV2Alert > Event configuration, added the template for the metrics/composite metrics events.InfoFor more information about the added template, see the following.
-
ChangedInV2Dashboard > Instance monitoring and Multiple instance monitoring, changed the order of columns of the Active sessions table saved in the Default preset. -
FixedInV2Stat/Report > PG SQL statistics, fixed the issue where the installation guide messages do not appear.
MySQL
Fixed In V2 Stat/Report > MYSQL SQL STATISTICS, fixed the issue where the installation guide messages do not appear.
Oracle
Changed In Stat/Report > Tablespace size, modified to display the table space information to be folded.
Kubernetes
Dashboard
-
FeatureIn Container Map, added the function to display the container/Pod blocks disappeared for one minute.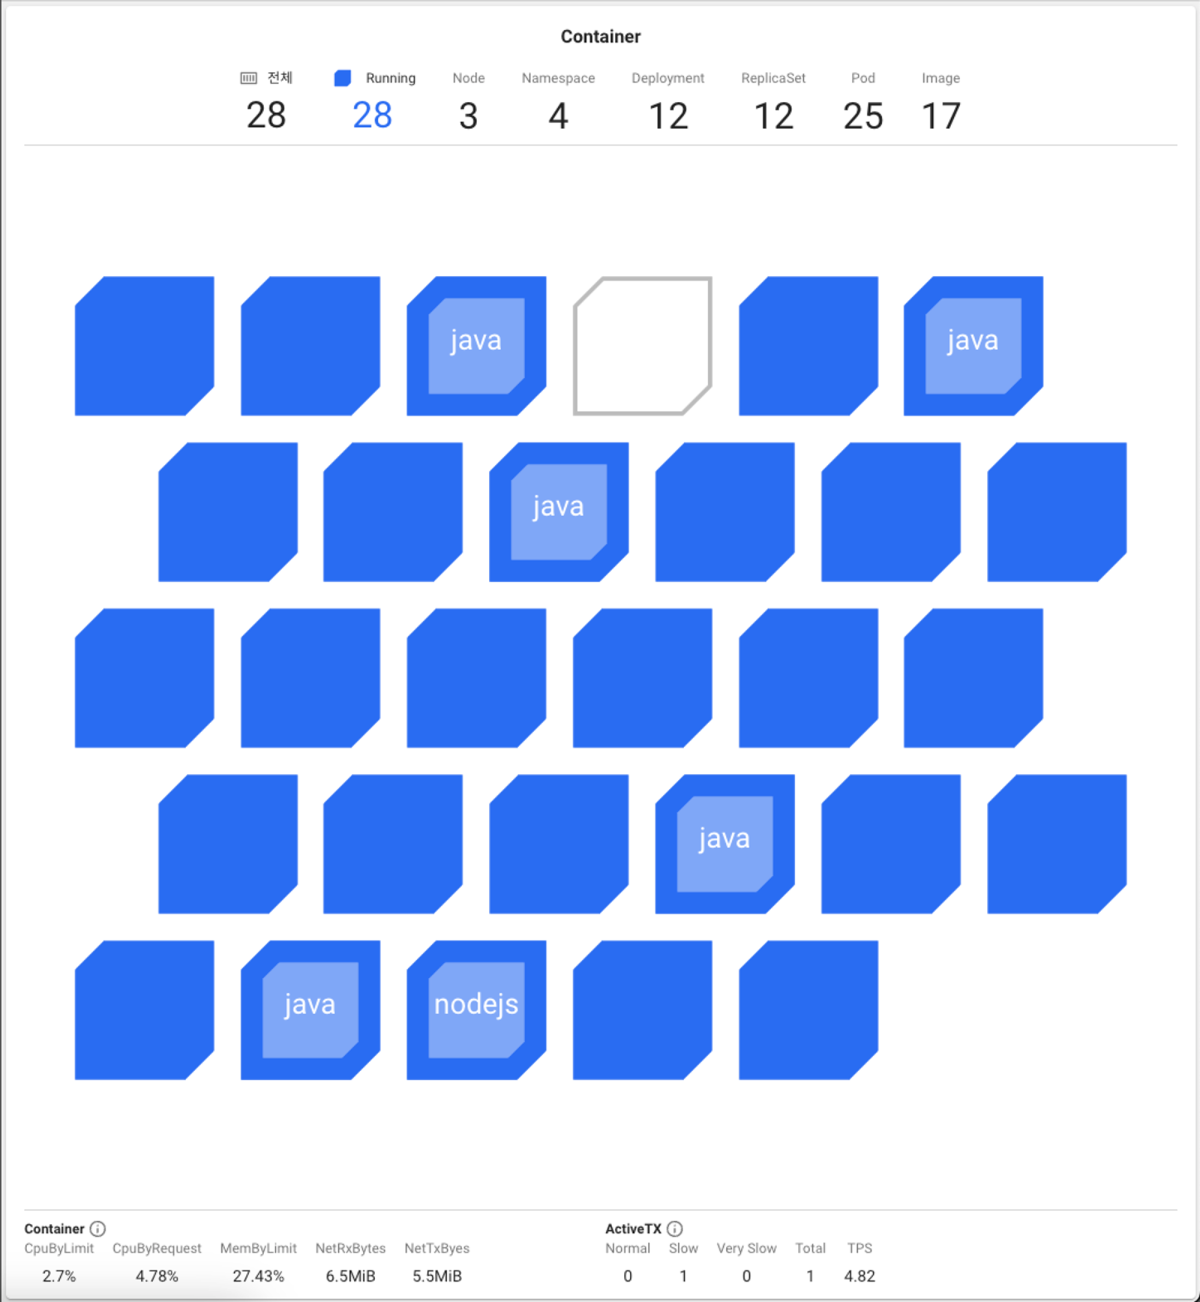
-
ChangedReplaced the menu, Application service dashboard with the enhanced dashboard. For more information about changes, see the following. -
ChangedIn the summary panel of the Container Map menu, changed the design for elements undert the Event tab.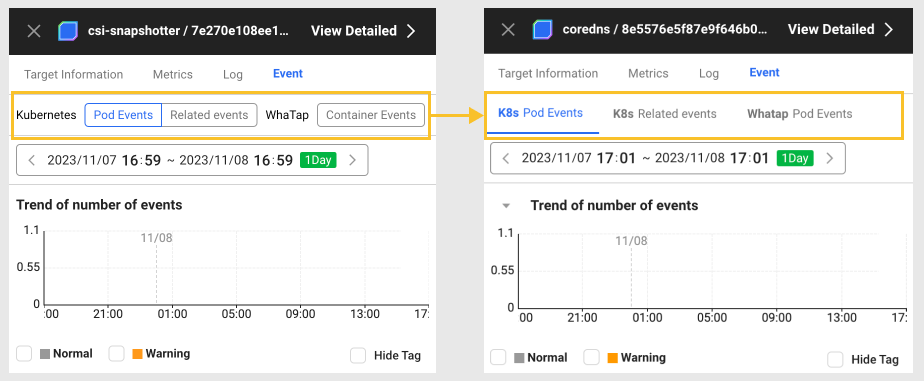
Resource
-
FeatureAdded the Cluster Summary menu.InfoA summary of cluster information is provided. You can check not only cluster projects but also information separated by namespace projects by integrating them. For more information, see the following.
-
FeatureIn Node details, added the State column in the Container table. -
ChangedThe Node list menu has been reorganized as follows:-
Added the metric for node data (cluster project).
-
Added the Download CSV option.
-
Added the filter search function.
-
Removed the text search feature and replaced it with the filter search feature.
-
Changed the time update interval from 1 minute to 10 seconds.
-
Changed the comparison column to default exposure and deleted the Compare button.
-
Limited the display columns up to 20.
-
Improved UIs for user convenience.
-
-
ChangedThe Container list menu has been reorganized as follows:-
Added the Download CSV option.
-
Changed the comparison column to default exposure and deleted the Compare button.
-
Limited the display columns up to 20.
-
-
FixedIn Node list, deleted the columns (Network IP, Open file descriptors, and Selected tags) that are not to be collected.
Analysis
-
ChangedChanged the name of the POD initialization performance menu (POD → Pod). -
ChangedIn POD initialization performance, added and modified the columns.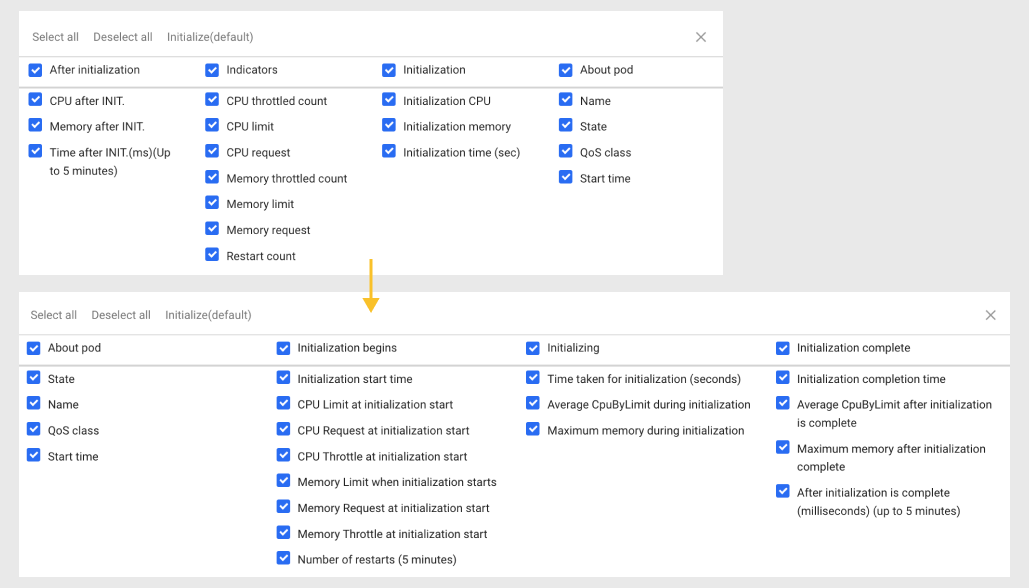
ETC
-
FeatureAdded Pending Pods as the lab menu of the namespace project. -
DeprecatedDeleted the Pod initialization performance menu for namespace projects.
Log
-
FeatureIn Log setting, added the function to export or import Log primary parser setting and Log secondary parser setting in JSON format. -
FeatureIn Log setting, added the function to export or import the Fast index settings in JSON format.
For more information, see the following.
Browser
Feature Enhanced the UI designs in the AJAX Hitmap menu and widget, and the AJAX Analysis function.
If you drag the chart area of the AJAX Hitmap widget in the following menu paths, you can see the new AJAX Analysis window.
-
Browser Monitoring Dashboard > AJAX Hitmap widget
-
Analysis > AJAX Hitmap
For more information about AJAX Hitmap, see the following.