Instance Monitoring
Home > Select Project > Dashboard > Monitoring a Database Instance
In Monitoring a Database Instance, you can monitor the key metrics of the database server, information details on active sessions, lock tree, PQ tree, and process information in real time. You can also see the alerts that could be problematic warnings. By default, the collected data for the last 10 minutes is retrieved in real time. Collected data is updated every 5 seconds.
Basic screen guide

-
 Selecting a lookup target
You can select an instance for inquiry. The collected data of the selected instance is automatically applied to the
 graph chart and the
  Active Sessions table.
 -
Graph chart section
The horizontal axis of each widget is time, and the vertical axis is the metric number. If you select a specific time period in each widget, Analysis > Count Trend appears.
NoteFor more information about Counts Trend, see the following.
-
Active Sessions | Lock Tree | Process Info
You can view the active session, lock tree, and process information.
-
Active Sessions
You can view active sessions and queries. If you select an item in the rightmost query column in the table, the SQL details window appears. You can see the full text and plan information for the selected query. For more information, see the following.
-
Lock Tree
You can see the lock session information, and holder and waiter information in real time. For more information about the table columns, see the following.
-
Process Info
You can query the resource usage of the database server in real time.
-
-
For more information about each metric, see the following.
-
For more information about the columns, see the following.
-
The process information can be viewed by additionally configuring the XOS agent. For more information, see the following.
Selecting a metric
You can change the metric of the graph chart widget placed on the screen to another one.
-
Select
 on the upper right of the widget to change the metrics.
 -
If the Count selector window appears, select a desired metric.

-
Select Save.
The metric of the selected widget is changed.
For more information about each metric, see the following.
Layout setting
To set the layout on the metrics chart, on the upper right of the screen, select ![]() . Nine (3x3) metrics charts are set on the default layout, and you can change the number of charts on a page.
. Nine (3x3) metrics charts are set on the default layout, and you can change the number of charts on a page.

Using the active session section
Through Active sessions at the bottom of the screen, you can see the real-time active sessions. The following provides the guide for the button on the upper right of the table.
 : You can stop changing the data collected in real time. To restart it again, select
  .
.
-
 : The list of tables is refreshed.
 -
 : The column header entries in the table can be displayed or hidden.
-
 : You can filter the list based on the column header entries in the table. After selecting the button, you can set the conditions in each header column such as Includes, Excludes, Equal, and Unequal.Note
Adjust the column width if the text field for filter condition options is invisible.
-
 : You can download the content of the table as a CSV file.
Stopping an active session
You can stop a session(s) that has been running for a long time.
-
In the active sessions list, move your mouse cursor to the item.
-
Select the
 that appears on the utmost right.
 -
If the Session kill window appears, enter the password.
-
Select Apply.
The session is stopped.
-
Through the paramkey.txt file in the DBX agent installation path, you can find the password.
-
This feature is only available to the members with Edit role. For more information about member roles, see the following.
Zooming in the graph chart section

If the current screen is small and difficult to see the widget, you can check the graph chart widget in a wider screen. Select ![]() in the Active sessions section at the bottom of the screen. The Active sessions section is collapsed and the graph chart widget section is enlarged.
in the Active sessions section at the bottom of the screen. The Active sessions section is collapsed and the graph chart widget section is enlarged.
To zoom out the graph chart widget, select ![]() at the bottom of the Active sessions section.
at the bottom of the Active sessions section.
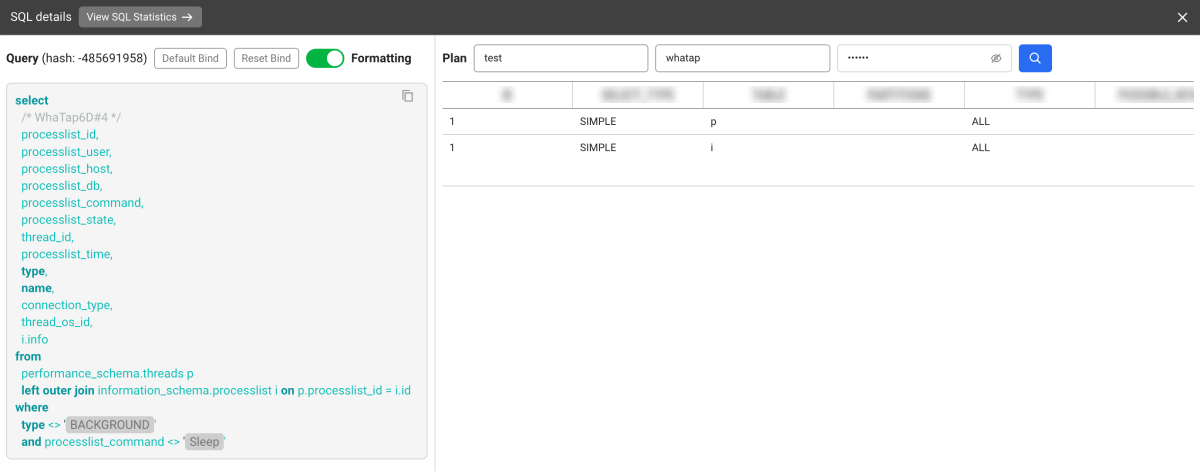
See query details
To check the SQL query information of the current running session, select the query column in the Active sessions section. The SQL details window appears. You can check the SQL query statements and plan information.
-
View SQL Statistics: You can go to the SQL statistics menu where you can check statistical information related to the SQL query statement.
-
Default Bind: You can bind the part set as a variable in the query sentence to the default value.
-
Reset Bind: You can release the bound default value and check the variable.
-
Formatting: You can improve readability by applying indentation and formatting to a SQL query statement.
-
Plan: To check plan information, enter DB Name, User Name, and Password, and then select
 .
.
Changing the table columns
You can display or hide the column entries in the table, and change their order.
-
Select
on the upper right of the table. -
When the Column Setting window appears, hide, add, or change the order of items to be displayed in the table columns.
- Select a column, and then
 ,
,  ,
,  or
or  . Go to Visible or Invisible.
 - You can move the position by dragging the column while it is selected.
- Select a column, and then
-
After all settings are finished, select Save.
The setting is saved as a browser cookie value to maintain the state even after refreshing the page. If an error occurs between settings due to cookie deletion or other reasons, it is initialized.
Column information guide
| Item | Description |
|---|---|
| tranindex | Transaction index |
| user | Database user name |
| host | Host name of CAS that performs transactions |
| pid | Broker process ID |
| program | Client program name |
| query_time | Total execution time of active queries (unit: second) |
| tran_time | Total execution time of transactions (unit: second) |
| transtatus | Transaction status |
| lock_holder | List of transactions that own a lock if transactions are waiting for the lock |
| sql_id | ID for SQL text |
| sql_text | Query statement being executed (up to 30 characters) |
| sql_param | Literal value separated from query |
| sql_hash | Hash value of query (internal WhaTap control value) |