Page Load
Home > Select Project > Dashboard > Page Load
In the Page Load dashboard, you can monitor Core Web Vitals (CWV) related to page load and performance data such as resources and AJAX in real time. This can help you understand the factors that affect the web application experience and derive improvements.
-
On the upper right of each widget, select
 . Then you can see the widget data in full screen.
 -
If you select
 on the upper right of the widget, the chart configuration screen appears. You can set the options to display on the chart.
 -
Depending on the screen size of the web browser, the icon shape on the upper right of a widget may differ. If you select
 , the additional icons appear.
 -
For more information about the widget configuration, see the following.
CWV-related widgets
Core Web Vitals (CWV) means three metrics that Google considers important among various measures that affect the end-user experience.
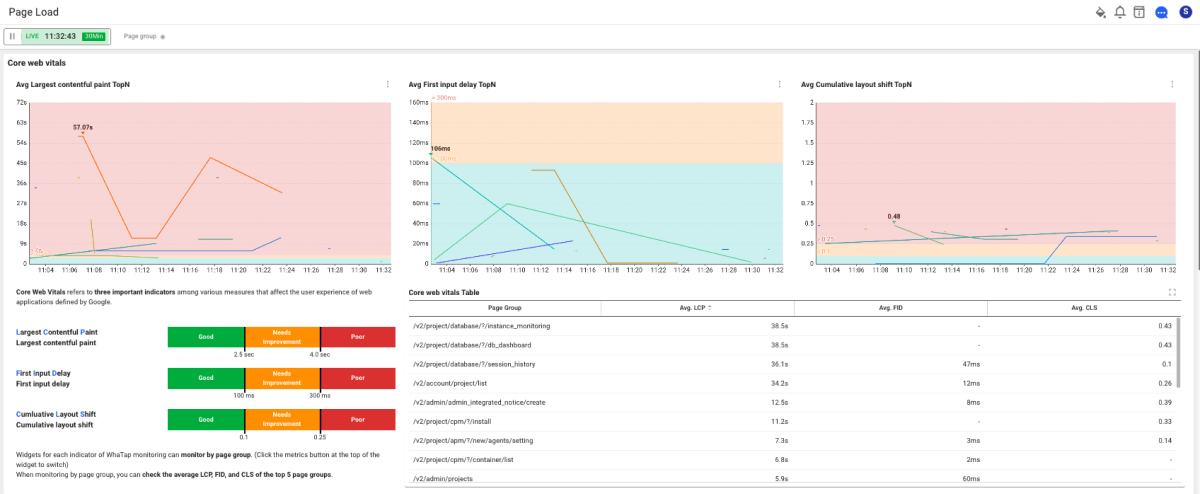
Through the Google Core Web Vitals Report, you can see how the page performance affects the end user experience.
Average Largest contentful paint
Largest Contentful Paint (LCP) reports the rendering time of the largest image or text block in the browser viewport based on the first page load. It is an important user-centric metric that allows you to measure page load times as perceived by end users. A fast LCP helps end users perceive that the page is available.

To provide an optimized user experience, your web application must have an LCP of 2.5 seconds or less. The Avg Largest contentful paint TopN widget allows you to see the average LCP based on the page group or all pages. If you see the chart by page group, it provides you the average LCP for the top 5 page groups.
Average First input delay
First Input Delay (FID) measures from when an end user first interacts with a web application page (click a link, tap a button, or use the custom Javascript-based controls) to the time until the browser starts processing the event handler in response to the interaction. It is a metric of the user's experience when interacting with an unresponsive page. When the FID is low, users consider that the page can be used normally.

To provide an optimized user experience, your web application must have an FID of 100 ms or less. The Avg First input delay TopN widget allows you to see the average FID based on the page group or all pages. If you see the chart by page group, it provides you the average FID for the top 5 page groups.
Average Cumulative layout shift
Cumulative Layout Shift (CLS) is an important user-driven metric for measuring visual stability by quantifying the frequency with which end users experience unexpected layout shifts. A low CLS helps ensure a good user experience.

CLS must be kept below 0.1 to provide an optimized user experience. The Avg Cumulative layout shift TopN widget allows you to see the average CLS based on the page group or all pages. If you see the chart by page group, it provides you the average CLS for the top 5 page groups.
Core Web Vitals Table

Based on the lookup time, for each page group, the average LCP (Avg. LCP), average FID (Avg. FID), average CLS (Avg. CLS) can be checked in the table. You can click the table header column to sort by column.
Page Load Timing-related widget
When an end user accesses a web application, the page load time and load count allow you to determine when loading a page takes so long and which pages are causing load.
Average Page Load Time / Page Load Count

If an end user accesses the page of the web application, you can see the Avg Page load time TopN and Page load count TopN based on the real time or selected time. The load times and load counts are provided for each page group by default.
-
When viewed by the page group, it provides the average page load time and page load count for the top 10 page groups.
-
If you hover your mouse over the widget chart, you can see the page groups, average page load times, and page load counts in the form of tooltip.
Average Router Change Time / Router Change Count

When the end users switch to a web application page that consists of single page applications (SPA), you can see values for Avg Router change time TopN and Router Change Count TopN based on the real time or the selected time. The router change times and change counts are provided for each page group by default.
-
When viewed by the page group, it provides the average router change time and change count for the top 10 page groups.
-
If you hover your mouse over the widget chart, the page group, average router change time, and change count are provided in the form of tooltip.
Page load table

For each page group (Page Group), the page load count (Load count), average load time (Avg. Load Time), average back-end process time (Avg. Backend Time), average frontend process time (Avg. Frontend Time) can be checked in the table. You can click the table header column to sort by column.
Resource-related widget
You can identify resources that affect the page load. It is recommended that the load time of the resource not exceed 800 ms.
Average Resource Response Time / Resource Count

It provides a chart for the average resource response time and resource count that occurred during loading pages. Select Resource Path on the upper right of the widget to check the data based on Resource Host and All resources.
-
When viewed based on the Resource Path and Resource Host, the average response time and count for the top 10 resources are provided.
-
If you hover your mouse over the widget chart, the average resource response time and resource count are provided in the form of tooltip.
Resource Table

In the Page Load - Resource Table widget, you can see a chart for the path reference of the resource URL and the requested page. You can search data by selecting Resource Path on the upper right of the widget and switching based on the page group.
AJAX-related widget
You can identify AJAXs that affect the page load. When the rendering data is provided through AJAX, the screen rendering may take long if the response is slow.
Avg AJAX Response Time / AJAX Count

It provides a chart for the average AJAX response time and AJAX count that occurred during loading pages. Select AHAX Path on the upper right of the widget to check the data based on AJAX Host and All AJAX.
-
When viewed based on the AJAX Path and AJAX Host, the average response time and count for the top 10 AJAX cases are provided.
-
If you hover your mouse over the widget chart, the average AJAX response time and AJAX count are provided in the form of tooltip.
AJAX Table

In the Page Load - AJAX Table widget, you can see a chart for the path reference of the AJAX URL and the requested page. You can search data by selecting AJAX Path on the upper right of the widget and switching based on the page group.