Event History
Home > Select Project > Alert > Event history
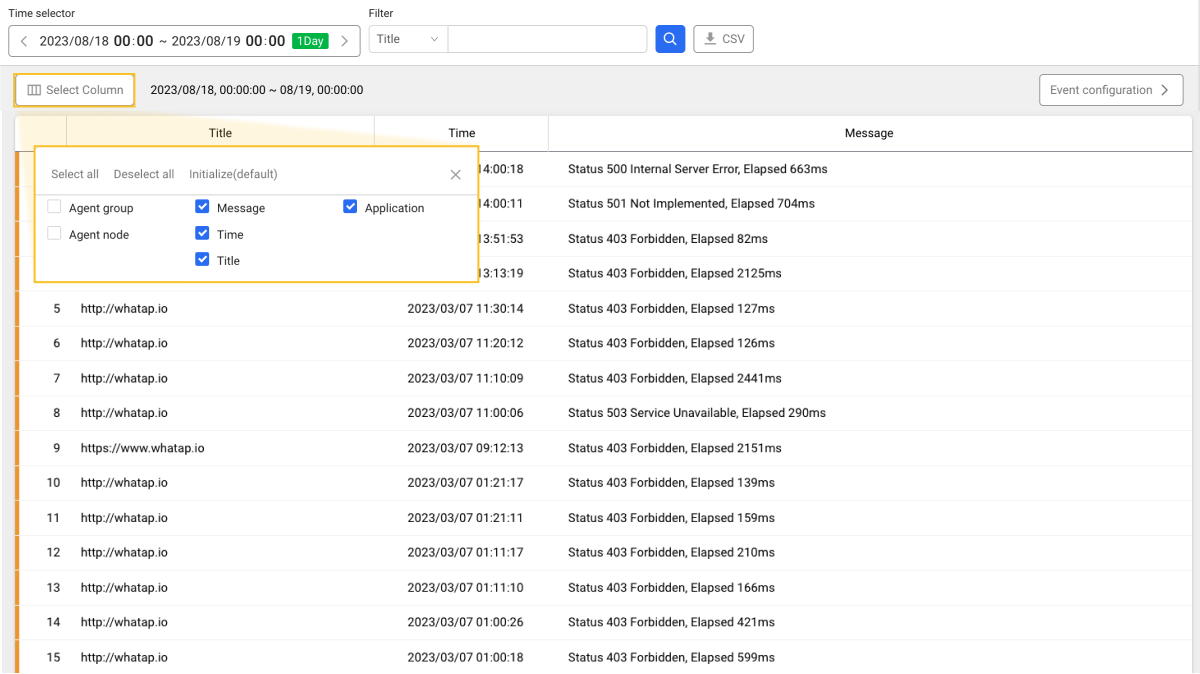
You can check the details of events that occurred in the monitoring target during a specific time period. You can analyze the root cause of problems that occurred in the monitoring target or identify the system status upon performance degradation or error.

The items displayed in the event list are the ones set in Alert > Event Configuration. You can move to the corresponding menu by selecting Event configuration on the upper right of the screen.
-
You can search up to the last one year's history.
-
The screen images may differ depending on the selected project.
Viewing the event records
Set the following options in order and then select . You can search event records based on the set options.
-
Time selector: You can set the time range for events to search for. It searches based on Event time.
NoteFor more information on how to use the Time selector option, see the following.
-
Filter: It filters the list of events that contain the entered string based on the content of Event title or Message.
Viewing the event list
The following are descriptions of the items that appear in the event list.
-
Event title: Title of the event added in the Event configuration menu.
-
Event time: Event occurred time.
-
Acknowledge: You can stop sending repeated notifications for the target event by registering the processed records. For more information, see the following.
-
If an event is in progress and not resolved, the In progress tag appears.
-
Maintenance plan If an event occurs during the maintenance time registered in the menu, the Occured during maintenance tag appears. This event does not send a notification.
-
-
Event resolution time: Time when the event that occurred was resolved.
- Message: Details of the event added in the Event configuration menu.
Registering the processed records
When you register the processing history, it makes it easy to update the event processing status and manage its history.
When you register the processing history, the Recurring alert (escalation) of the event is suspended. For more information about Recurring alert (escalation), see the following.
-
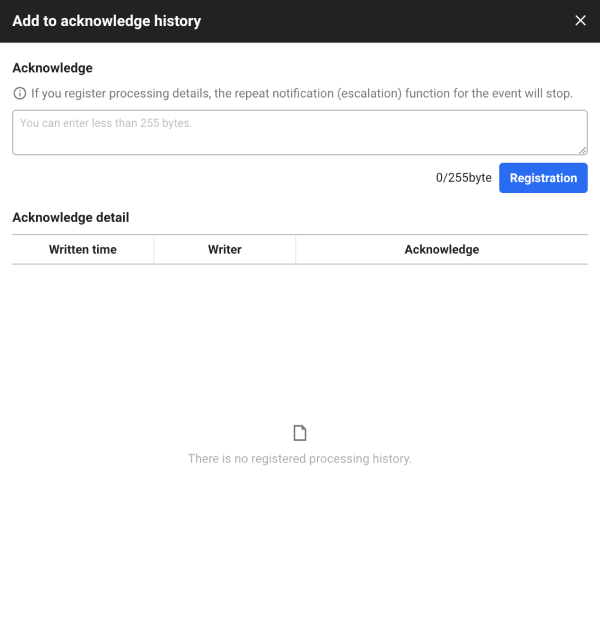
In the event to handle the processing history, select Acknowledge.
-
When the Add to acknowledge history window appears, enter the processed results.

-
Select Registration.
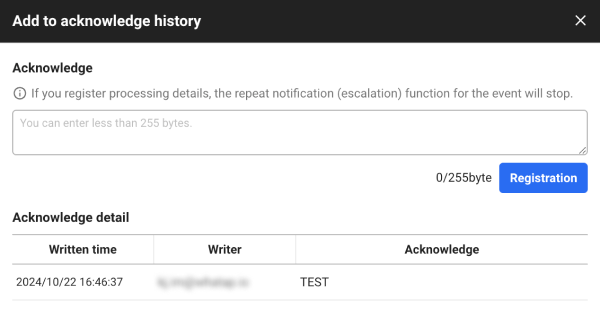
The registered processing history appears as a list in Acknowledge detail. You can check the creation time, author, and details.

You can check the number of processed records added in the event list.

Processed details can be entered up to 255 Bytes.
Using additional options
-
Column Settings: You can add, delete, and change the order of columns in the event list.
-
CSV: You can save the searched event history records as a CSV file. Click CSV, enter Maximum CSV lines, and then select Download.
-
View only events in progress: You can view only the ongoing events in the event history list.
-
Event configuration: Go to Alert > Event configuration.
Setting the table columns
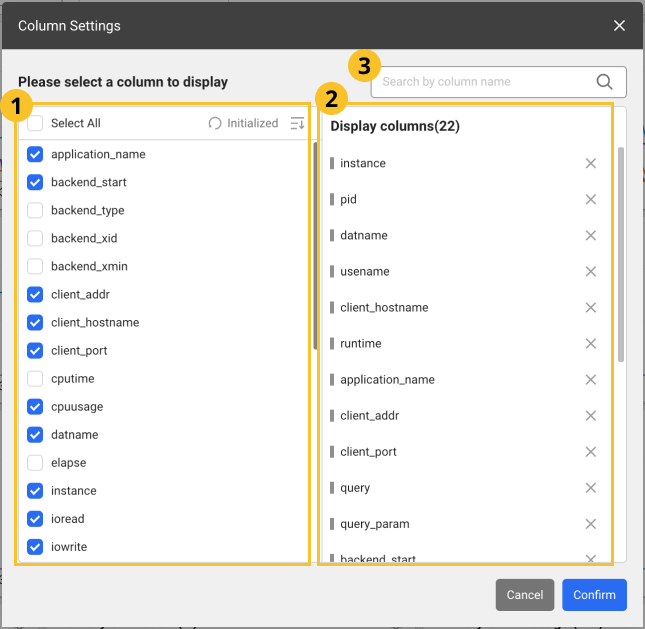
You can hide the table header columns or add any of them. You can also change the column order. Select .

-
After configuration, select Confirm to apply the settings in the table.
-
In the
search bar, enter text to search the desired columns. Only the columns that meet the entered text are displayed.
-
Images may differ depending on the product, project, or menu.
Adding columns
From the list, select the items to add as table header columns. To select all items, select Select All.
Deleting columns
From the list, unselect the columns to delete. Alternatively, select
on the right of the item to delete from the
list.
Changing the column order
Drag an item to reposition from the list, and then move it to the desired position.
Initializing the configuration
To cancel all changes and reset them, select Initialized.