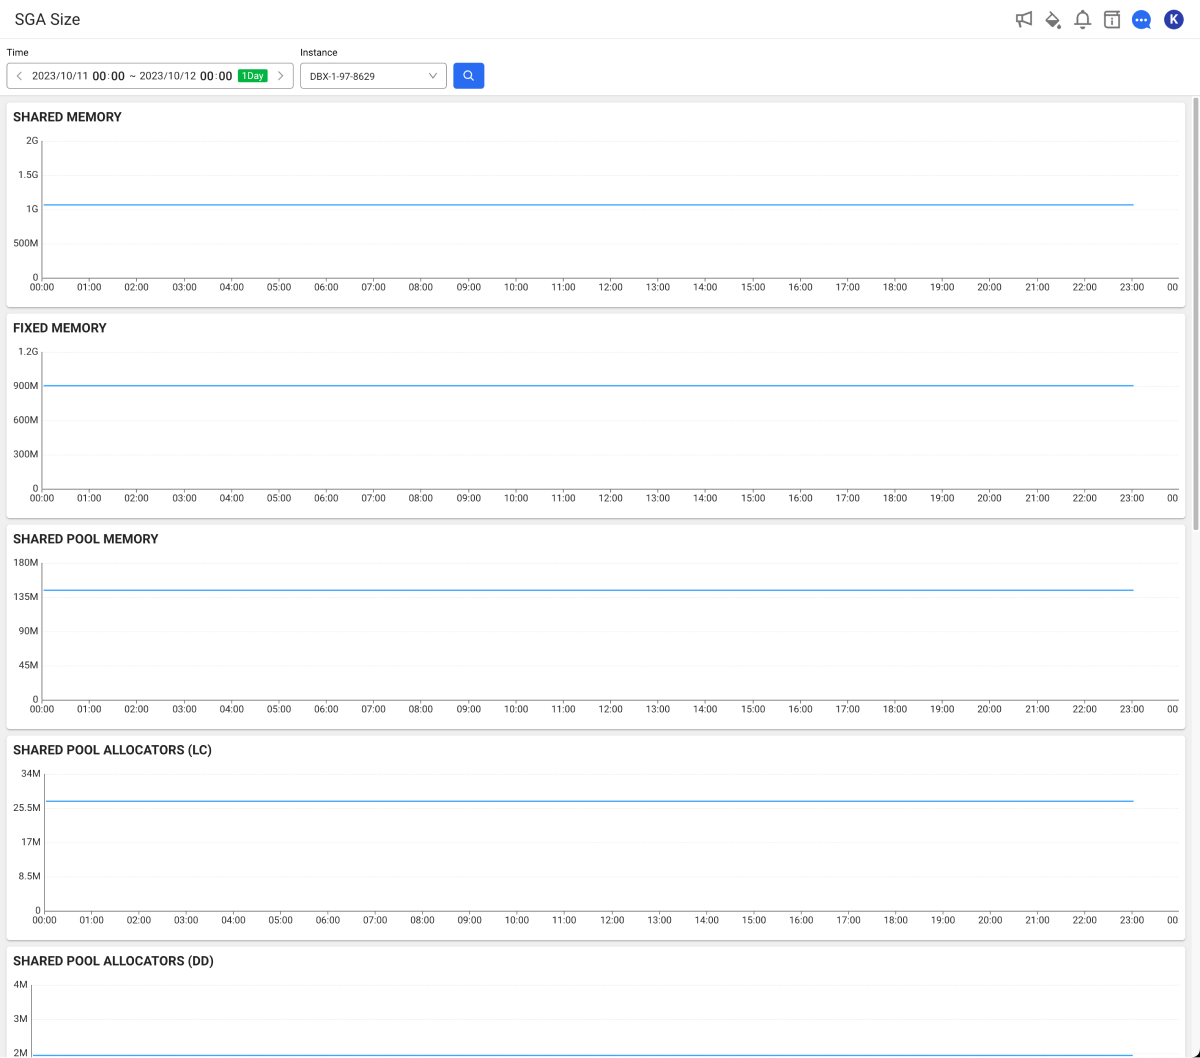
SGA size
Home > Select Project > Stat/Report > SGA Size
You can monitor timely changes by saving summaries of System Global Area (SGA) that is an server memory area.
-
Performance optimization: By monitoring the sizes and usage of various memory areas within the SGA to proactively prevent performance issues and optimally manage memory resources.
-
Bottleneck detection: By early detecting the bottlenecks occurring in each memory area, the availability and stability of the system can be improved.
-
Resource management: You can check whether memory resources are allocated appropriately to reduce unnecessary memory usage and efficiently distribute memory resources.
-
Troubleshooting: By identifying which part of the SGA area are overused so you can quickly troubleshoot the cause of poor performance.
Basic usage guide

-
Set the time to search in Time.
-
Select an instance name to view the trend data of the instance.
-
Select
.
-
The query time can be set up to 3 weeks.
-
For more information on how to use the Time option, see the following.
Monitoring items
By continuously monitoring the following items, improve the efficiency of the database and prevent occurrence of incidents.
-
SHARED MEMORY
It is the memory area shared between multiple processes in the database. It stores key data and program codes and allows multiple processes to access it simultaneously. You can determine the capacity and efficiency of the memory being used by the database and prevent memory shortages or bottlenecks in advance.
-
FIXED MEMORY
It is a fixed memory area that is initialized when the database boots, and various fixed structures required for database operation are located there. It is set to a fixed size, so it does not change but you can check how much of the total memory usage it occupies. If a memory shortage occurs, check the fixed memory area.
-
SHARED POOL MEMORY
It is a memory area that includes SQL and PL/SQL cursors, library cache, data dictionary cache, and such. This memory plays an important role in SQL reusability. You can monitor this memory to check SQL reusability and see if SQL hard parsing increases due to memory shortage. This helps prevent performance degradation.
-
SHARED POOL ALLOCATORS (LC)
Amount of memory allocated to the library cache, which caches execution plans and SQL statements to improve the performance. Determine whether execution plan caching works effectively or unnecessary memory usage degrades the performance.
-
SHARED POOL ALLOCATORS (DD)
Amount of memory allocated to the data dictionary cache, which stores information about database objects. Keeping the data dictionary cache at an appropriate size can improve performance by allowing quick query about database objects.
-
SHARED POOL ALLOCATORS (SLAB)
Memory slab is a space used to manage memory allocation more efficiently. You can monitor this memory to improve the memory management efficiency. Try reducing unnecessary memory usage or resource waste.
-
SHARED POOL ALLOCATORS (MISC)
It is the memory area of SHARED POOL that is used for various purposes. Trace other memory usage to see if any abnormal memory usage occurs.
-
SHARED POOL ALLOCATORS (Total)
Total memory size allocated from SHARED POOL. This is the total sum including LC, DD, SLAB, MISC, and such. It can help you understand the overall memory usage and prevent performance degradation caused by memory shortage.
-
Database Buffers
The database buffer cache stores data blocks in memory to reduce physical disk I/O. You can monitor the usage of database buffers to increase cache hit rate and optimize performance. Make sure data blocks are cached appropriately.
-
Redo Buffers
A buffer that records changes when transactions occur in the database. This information is later saved as a log. Monitoring the Redo buffer usage can help you manage it so that log writing does not become a bottleneck. This can help improve the transaction performance.