Monitoring a Database Instance
Home > Select Project > Dashboard > Monitoring a Database Instance
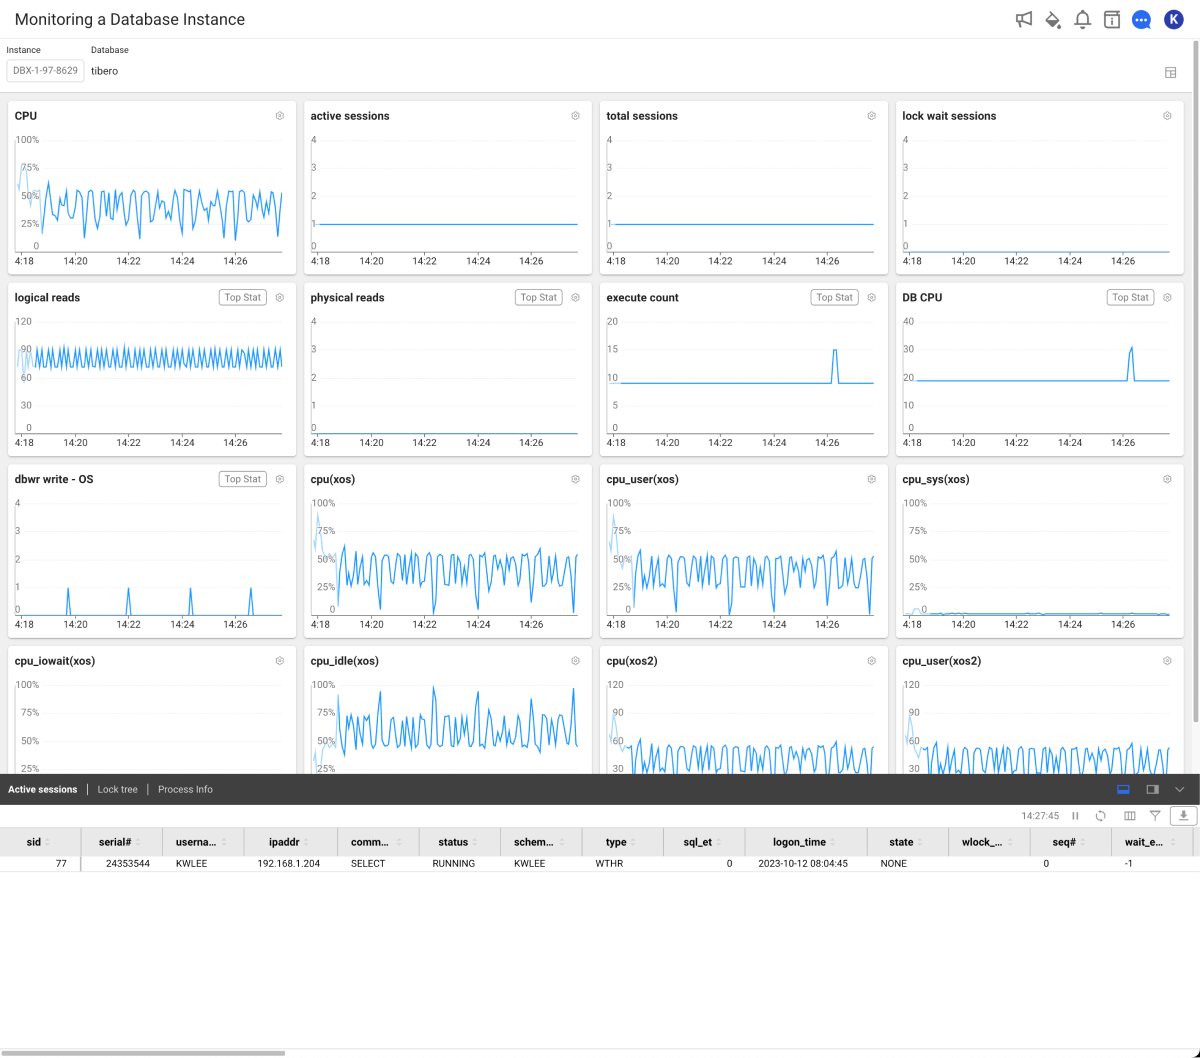
In Monitoring a Database Instance, you can monitor the key metrics of the database server, information details on active sessions, lock tree, PQ tree, and process information in real time. You can also see the alerts that could be problematic warnings. By default, the collected data for the last 10 minutes is retrieved in real time. Collected data is updated every 5 seconds.
Basic screen guide
-
 Selecting a lookup target
You can select an instance and a database included in the instance for data inquiry. The collected data of the selected instance and its database are automatically applied to the
 graph chart and the
  Active Sessions table.
 -
Graph chart section
The horizontal axis of each widget is time, and the vertical axis is the metric number. If you select a specific time period in each widget, Analysis > Counts Trend appears.
-
Active sessions | Lock tree | Process Info
You can view the active session, lock tree, and process information.
-
Active sessions
You can view active sessions and queries. If you select an item in the rightmost sql_text or query column in the table, the SQL details window appears. You can see the full text and plan information for the selected query. For more information, see the following.
-
Lock tree
You can see the lock session information, and holder and waiter information in real time. For more information about the table columns, see the following.
-
Process Info
You can query the resource usage of the database server in real time.
-
Active sessions
-
Colors in the database correspond to the ones in the graph chart.
-
For more information about Counts Trend, see the following.
-
For more information about each metric, see the following.
-
For more information about the columns, see the following.
- The Process Info can be viewed by additionally configuring the XOS agent. For more information, see the following.
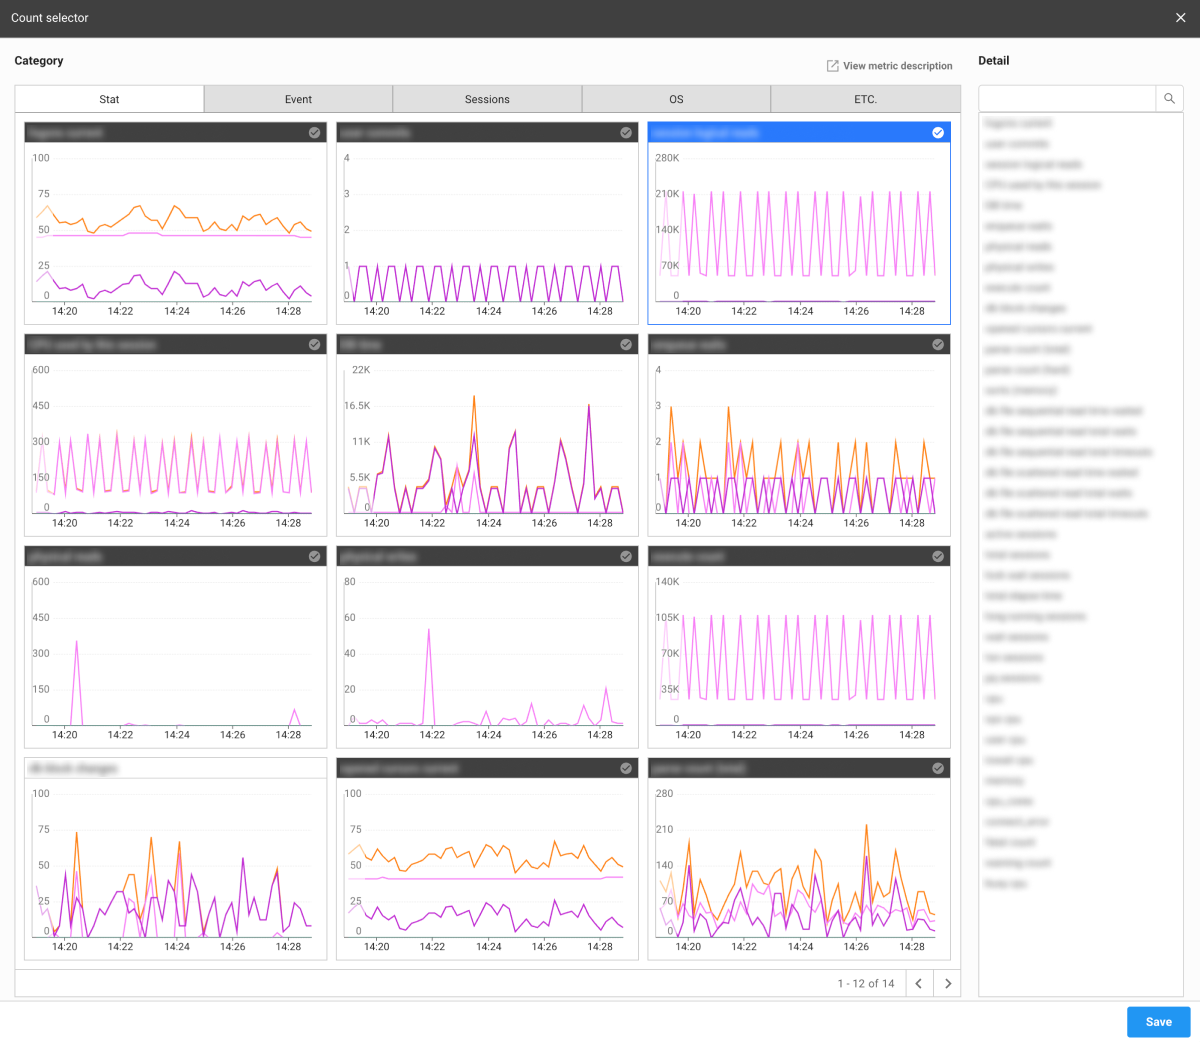
Selecting a metric
You can change the metric of the graph chart widget placed on the screen to another one.
-
Select
 on the upper right of the widget to change the metrics.
 -
If the Count selector window appears, select a desired metric.
-
Select Save.
The metric of the selected widget is changed.
For more information about each metric, see the following.
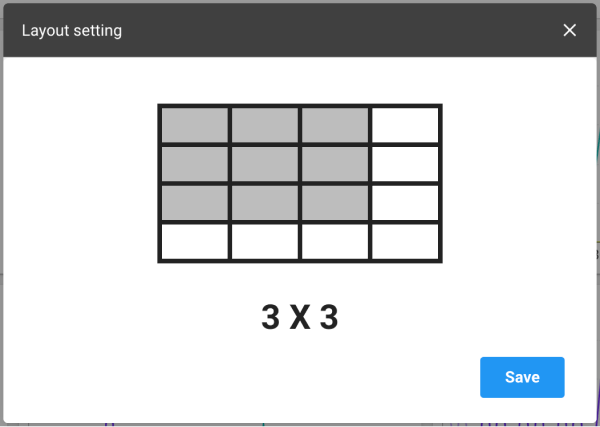
Layout setting
To set the layout on the metrics chart, on the upper right of the screen, select ![]() . Nine (3x3) metrics charts are set on the default layout, and you can change the number of charts on a page.
. Nine (3x3) metrics charts are set on the default layout, and you can change the number of charts on a page.
Using the active session section
Through Active sessions at the bottom of the screen, you can see the real-time active sessions. The following provides the guide for the button on the upper right of the table.
 : You can stop changing the data collected in real time. To restart it again, select
  .
.
-
 : The list of tables is refreshed.
 -
 : The column header entries in the table can be displayed or hidden.
-
 : You can filter the list based on the column header entries in the table. After selecting the button, you can set the conditions in each header column such as Includes, Excludes, Equal, and Unequal.Note
Adjust the column width if the text field for filter condition options is invisible.
-
 : You can download the content of the table as a CSV file.
Stopping an active session
You can stop a session(s) that has been running for a long time.
-
In the Active sessions list, move your mouse cursor to the session to terminate.
-
Select the
 that appears on the utmost right.
 -
If the Session kill window appears, enter the password.
-
Select Apply.
The session is stopped.
-
Through the paramkey.txt file in the DBX agent installation path, you can find the password.
-
This feature is only available to the members with Edit role. For more information about member roles, see the following.
Zooming in the graph chart section

If the current screen is small and difficult to see the widget, you can check the graph chart widget in a wider screen. Select ![]() in the Active sessions section at the bottom of the screen. The Active sessions section is collapsed and the graph chart widget section is enlarged.
in the Active sessions section at the bottom of the screen. The Active sessions section is collapsed and the graph chart widget section is enlarged.
To zoom out the graph chart widget, select ![]() at the bottom of the Active sessions section.
at the bottom of the Active sessions section.
See query details
To check the SQL query information of the executing session, select the query (or sql_text) column in the Active sessions section. The SQL details window appears. You can check the SQL query statements and plan information.
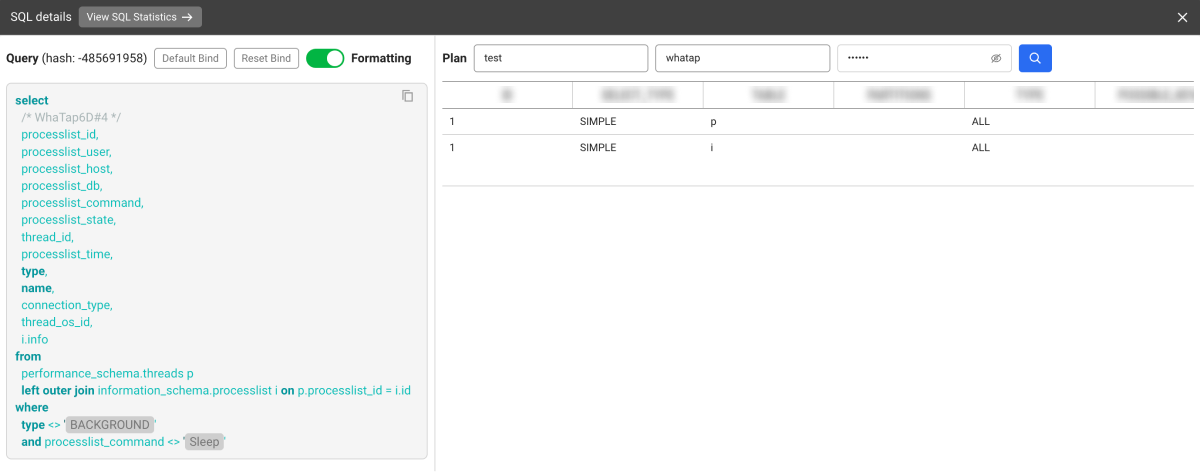
- View SQL Statistics: You can go to the SQL statistics menu where you can check statistical information related to the SQL query statement.
Changing the table columns
You can display or hide the column entries in the table, and change their order.
-
Select
on the upper right of the table. -
When the Column Setting window appears, hide, add, or change the order of items to be displayed in the table columns.
- Select a column, and then
 ,
,  ,
,  or
or  . Go to Visible or Invisible.
 - You can move the position by dragging the column while it is selected.
- Select a column, and then
-
After all settings are finished, select Save.
The setting is saved as a browser cookie value to maintain the state even after refreshing the page. If an error occurs between settings due to cookie deletion or other reasons, it is initialized.
Column information guide
For more information about columns, see the link.
- Active session
- Lock tree
- Process information
| Item | Description |
|---|---|
action | Name of the running job. |
block_updates | Number of block updates. |
block_updates_sigma | Total number of block updates. |
client_identifier | Client ID. |
client_info | Additional information of the client. |
client_pid | PID of the client process. |
command | Command running in the current session. |
consumed_cpu_time | CPU time consumed by the session. |
consumer_group | Consumer group to which the session belongs. |
cpu(xos) | CPU utilization |
cpuusage | CPU usage consumed by the session. |
event_name | Name of the waiting event. |
execute_count | Number of SQL executions. |
execute_count_sigma | Total number of executions. |
id1 | First identifier value. |
id2 | Second identifier value. |
ioread(xos) | Actual time spent reading the block (milliseconds). |
iowrite(xos) | Actual time spent writing the block (milliseconds) |
ipaddr | Client IP address. |
logon_time | Time when the session logged in the database. |
logical_reads | Number of logical read operations. |
logical_reads_sigma | Total number of logical read operations. |
machine | Name of the machine on which the session is running. |
module | Name of the running module. |
os_thr_id | Thread ID of the operating system. |
osuser | User of the operating system running the session. |
parse_count_hard | Number of hard parses. |
parse_count_hard_sigma | Total number of hard parses. |
parse_count_total | Total number of parses. |
parse_count_total_sigma | Total number of parses. |
pdml_enabled | Whether parallel DML is enabled or not. |
pdml_status | Status of the parallel DML. |
pddl_status | Status of the parallel DDL. |
pga_used_mem | Amount of memory being used in the process global area (PGA). |
physical_reads | Number of physical read operations. |
physical_reads_sigma | Total number of physical read operations. |
pid | PID of the database process. |
pq_status | Status of the parallel query. |
prev_sql | Text of the previously executed SQL statement. |
prev_sql_id | Unique ID of the previously executed SQL statement. |
prev_sql_param | Parameter of the previously executed SQL. |
prog_name | Name of the program running the session. |
pss(xos) | Process specific memory usage + Percentage of shared memory occupied by one process. |
row_wait_block_no | Block number of the waiting row. |
row_wait_file_no | File number of the waiting row. |
row_wait_obj_id | Object ID of the waiting row. |
row_wait_row_no | Row number of the waiting row. |
rss(xos) | Resident Set Size (RSS) that is the number of physical pages associated with the process. |
schemaname | Name of the schema the session is using. |
seq# | Value indicating the sequence number of the session. |
sid | Session ID that uniquely identifies the session. |
sql_et | SQL execution time. |
sql_hash | Hash value of the SQL statement. |
sql_id | Unique ID of the SQL statement being executed. |
sql_param | Parameters used to execute SQL. |
sql_text | Text of the SQL statement being executed. |
sql_trace | Whether to trace SQL. |
state | Current state of the session. |
status | Status of the session. |
terminal | Name of the terminal to which the session is connected. |
type | Type of the session. |
usn | Undo segment number. |
used_blk | Number of used blocks. |
used_rec | Number of used records. |
wait_event | Event that the session is waiting for. |
wait_time | Waiting time. |
wlock_wait | Whether the session is waiting for a lock or not. |
wthr_id | Thread ID of the session's work. |
| Item | Description |
|---|---|
event | Name of the waiting event. |
holder type | Type of the session that owns a lock. |
id1 | First identifier value. |
id2 | Second identifier value. |
lock mode | Lock mode requested or owned by the current session. |
lock request | Status of the lock requested by the session. |
module | Name of the running module. |
pid | PID of the database process. |
prev_sql_id | Unique ID of the previously executed SQL statement. |
prev_sql_param | Parameter of the previously executed SQL. |
prev_sql_text | Text of the previously executed SQL statement. |
prog_name | Name of the program running the session. |
serial# | Serial number that distinguishes repeated attempts for the same session. |
sid | Session ID that uniquely identifies the session. |
sql_et | SQL execution time. |
sql_id | Unique ID of the SQL statement being executed. |
sql_param | Parameters used to execute SQL. |
sql_text | Text of the SQL statement being executed. |
status | Status of the session. |
username | Name of the user running the session. |
waiter type | Type of the session waiting for a lock. |
The following items are the metrics collected if the XOS agent has been installed.
| Item | Description |
|---|---|
cputime | CPU usage time |
cpuusage | CPU Utilization |
elapse | Elapsed time of CPU usage |
vsize | Virtual memory size (Kb) |
rss | Resident Set Size (RSS) that is the number of physical pages associated with the process. |
state | Process status |
ioread | Actual time spent reading the block (milliseconds) |
iowrite | Actual time spent writing the block (milliseconds) |
pss | Process specific memory usage + Percentage of shared memory occupied by one process |
uid | user id |
cmd | Executing command |
longcmd | Full path of cmd |
WhaTap basically stores the client-related information.