Parallel query tree
Home > Select Project > Analysis > Parallel Query Tree
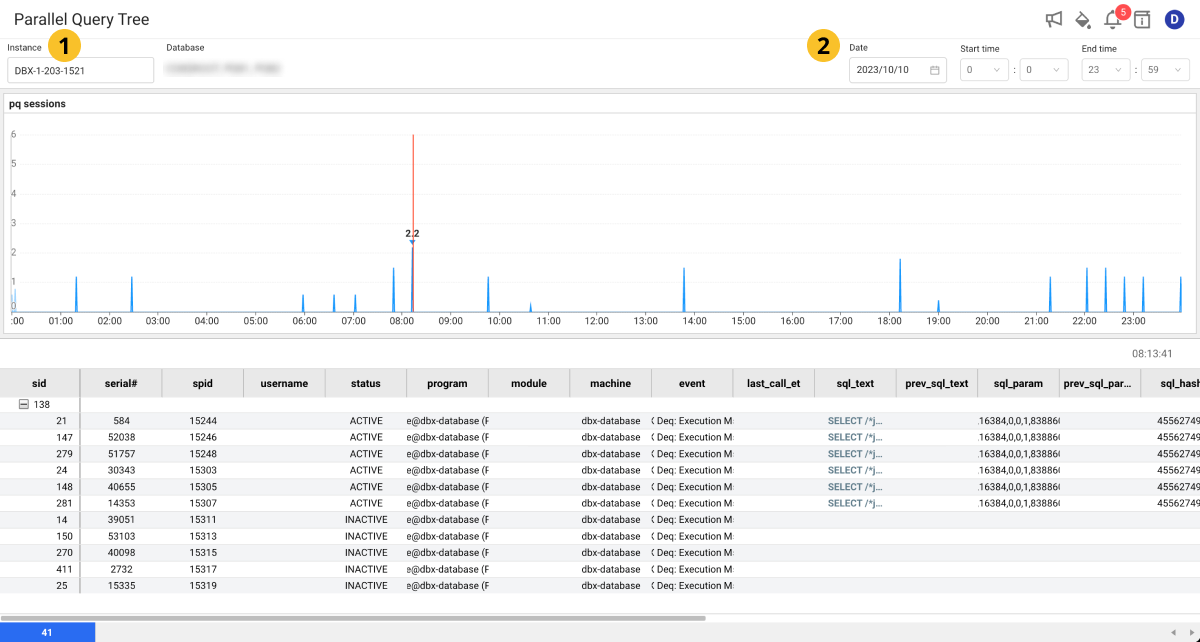
Parallel Query Tree provides the function to analyze the trend of parallel queries per day. The slave processes that perform actual tasks and the coordinator processes that assign tasks to them are distinguished, and overall executions are displayed in an easy-to-understand manner. It can help determine what purpose it was used for by providing information about parallel queries performed at a specific time point.
Basic screen guide

In Instance, select the instance to search parallel queries from, and then
set the Date, Start time, and End time.
You can check the trend of parallel queries that meet the set conditions through a graph chart, and the structure of coordinators and slaves is represented in the form of tree.
Column information guide
| Item | Description |
|---|---|
block_updates | Number of block updates. |
client_pid | PID of the client process. |
event | Name of the waiting event. |
logon_time | Time when the session logged in the database. |
logical_reads | Number of logical read operations. |
machine | Name of the machine on which the session is running. |
module | Name of the running module. |
physical_reads | Number of physical read operations. |
pid | PID of the database process. |
prev_sql_param | Parameter of the previously executed SQL. |
prev_sql_text | Text of the previously executed SQL statement. |
prog_name | Name of the program running the session. |
seq# | Value indicating the sequence number of the session. |
sid | Session ID that uniquely identifies the session. |
sql_et | SQL execution time. |
sql_param | Parameters used to execute SQL. |
sql_text | Text of the SQL statement being executed. |
status | Status of the session. |
usn | Undo segment number. |
used_blk | Number of used blocks. |
used_rec | Number of used records. |
username | Name of the user running the session. |
wait_time | Waiting time. |
WhaTap basically stores the client-related information.